Category: (Natural) Resources

The page for industry wide information on leaders operating, investing and covering the energy and industrial transitions

Deeptech and Cleantech: No Country for Growth Equity

Deeptech and Cleantech: No Country for Growth Equity

“Price is what the market pays”

In business school the phrase was a reference to Eugene Fama’s “Efficient Market Theory”. But in today’s market it feels like this statement is now the valuation expert’s way of throwing their hand in the area and saying “who knows!?!”

I am not going to comment on Gamestop. Instead I am going to focus on how there is no real private market for late stage growth equity serving deeptech and cleantech businesses.

Cleantech and deeptech are generally long-horizon investments with sizable step-wise technical and commercial gains. In many ways these investments resemble pharmaceutical-related investments cycles and payouts. A number of high profile and developmentally expensive drugs don’t move to the next stage… but when a mass-market drug is FDA approved, the windfall covers the costs of the lost trials elsewhere.

There are many high-growth sustainability, electrification and broader deeptech-themed investments hitting the market at high profile valuations. As a private market investor, the valuation jumps these companies earn from the private-to-public move can be surprising.

A lot of people are pointing to public market froth as the logical explanation. The reality of SPAC transactions is that they are a big source of cash … and dilution for the target companies. But these same hi-growth private companies have been mostly starved of capital in the private markets. As a result, executives in the deeptech field are now trained to view financing risk as the primary barrier to investing in IP and subsequently hitting the big payout events.

Meanwhile, the SaaS vertical has every valuation metric meticulously analyzed around pricing. It’s the closest to a liquid market I’ve seen in the private markets: there are indices and the multiples are tracked religiously. There are still bumps when these SaaS companies go public, but the range is knowable. The reason this path to public is more streamlined for traditional SaaS companies is because there is a very healthy and robust late-stage growth equity market acting as a pre-public pool of capital.

The SPAC is effectively becoming the late-stage growth equity vehicle for the deeptech markets. As a result in some cases the future year valuations are being pulled (slightly) forward. And while it is easy to point to froth, I take the opposite view. These are clearly important and valuable companies with aligned economy, humanity and shareholder upside. I am glad that public market investors will be able to participate in the asset appreciation.

But, it’s a shame that our private growth equity markets weren’t able to help these companies grow a bit longer outside of the public eye. And so while it is helpful to have the SPACs in market, I actually believe the story here is the incredible opportunity for growth equity capital that serves the deeptech and cleantech environment.

Knowing the Energize team’s entrepreneurial approach, I expect we are going to do something about this…

Tweetstorm Summary of Joe Biden’s Climate Plan

Tweetstorm Summary of Joe Biden’s Climate Plan

Over the weekend I asked Twitter if I should cover Joe Biden’s Climate Plan by writing a blog post, tweeting a Tweetstorm, or hosting a ZOOM call. As you’d expect, Twitter followers wanted a Tweetstorm!

As you will see, I also tried to have some fun by including relevant Clark Griswold memes. 🤓👍😜

Without further ado, here it is:

New Energy Transition Exit: Generac acquires Enbala

New Energy Transition Exit: Generac acquires Enbala

First thing’s first: it is pretty rare for an energy transition M&A event to be on CNBC or Mad Money- but this deal did make primetime TV and the segment can be found here)

Strategic Rationale: Why Generac is now in the software business

Every Wednesday at 10am my house’s Generac generator roars to life for its 2-minute check. The generator is fed by a natural gas line and in the 2.5 years of living here it has been used twice to back-up the house when a storm knocked out the power lines. All the while, sitting in my garage is my Tesla. It has a 100 kWh battery pack mostly sitting idle and plugged in every day.

The cost declines of batteries and the continued progress of distributed energy resources like rooftop solar and at-home batteries mean that the residential back-up power system of the future will look quite different than the past. Instead of supersizing a generator we may just need a better software system to source and route power throughout a house during storms or peak energy hours. And the best software system will then aggregate a neighborhood of household profiles and work with the utility to manage area-wide load.

This narrative is exactly why Generac had to buy Enbala. Based in Waukesha, Wisconsin, Generac sells more than $2 billion of backup power generation products for residential, light commercial and industrial markets. Given how our power systems are decentralizing, Generac has a unique opportunity to capitalize on their distribution network and brand to be a key player in the distributed energy electric hardware and software market. The majority of Generac’s current generators are powered by diesel, gas, or oil. So in addition to building a battery business, the firm has to accelerate its’ software development. The CEO of Generac said this in the deal’s press release: “The deal solidifies Generac’s position as a market leader in Smart Grid 2.0 technologies and opens opportunities for the Company as a grid services provider.”

Enter Enbala, a leader in the Virtual Power Plant vertical

Enbala is a developer of a real-time energy-balancing technology designed to transform energy system operations. The company’s technology captures and aggregates available customer loads, energy storage and renewable energy sources to form a network of continuously controlled energy resources, enabling clients to control, optimize and dispatch distributed energy in real-time.

In simple terms, Enbala’s software helps market participants (utilities, large energy consumers) manage the increasingly distributed load of our power grid. This is called Distributed Energy Resource Management, or ‘DERMS’

Enbala was founded in 2003 and is based in Denver, Colorado. The company’s CEO, Bud Voss, has been at the helm since 2014.

The Financing History

There are a few “fasle-starts” in Enbala’s history that resulted in a recapitalization somewhere along the line. While data shows a 2003 founding, the company’s trajectory meaningfully changed when Bud Voss took the CEO job. With Bud leading the company, Enbala raised about $38M since 2014. The most recent round was an ~$8M Series B-1 with a post-money valuation of $60M. Existing investors included: ABB Technology Ventures, GE Ventures, National Grid, Obvious Ventures and ZOMA Capital.

The Exit

While the exit price-point was not given, it is widely accepted that investors made a nice return on their capital – although that may have been preference driven. Using the last post-$ valuation of $60M as a reference, I am going to assume the purchase price was somewhere between $50-70M. The revenue profile for the company was not detailed but I suspect that Generac paid a very sizable multiple given the strategic and complementary importance of the Enbala asset as detailed earlier.

What are the themes?

1- These businesses take time. A 2003 launch with a 2014 re-launch is a long horizon.

2- Remaining capital efficient is paramount. Most VC investors aim to achieve at least 3x+ cash on cash return. With an upside $100M transaction, this means you would target $30M of invested capital.

3- The buying universe is expanding! Generac is now in the software business. This isn’t your grandpa’s generator company anymore…

M&A Tracker

The link to the updates Energy Transition M&A tracker can be found here.

Sunday Sales Series: Distribution costs are the bigger pie

Sunday Sales Series: Distribution costs are the bigger pie

My former company, Choose Energy, has a list of electric rates by state. As you can see, the average US home consumes 897 kWh per month. And the average electricity rate in the US is 13.26 cents per kWh. This means the average US household pays a $119 monthly utility bill. This fact won’t surprise many.

The lesser known fact is the cost split between the energy supply and the distribution. 15 years ago the supply cost was ~66% of the energy bill and the transmission & distribution costs (the cost to maintain the poles & wires) was 33% of the bill.

Today, the energy supply prices are cratering due to the lower cost renewables replacing carbon-based generation. Now in the US, the energy supply tends to be below 50% of the bill and falling fast. In some parts of the US the supply portion of a bill is as low as 25% of the total cost.

On the other side of the equation, the cost to maintain our creaky power grid’s transmission (big scale) and distribution system (local) is only getting more expensive as weather events and general physical-world problems wreak havoc on the infrastructure.

Over the past two decades the majority of the energy entrepreneur focus has been on the energy supply side of the equation. I am just now starting to see more businesses focusing on the transmission and distribution opportunity. And given that Americans pay more for the distribution than the power itself, there should be a big reward for the company’s that focus on this distribution opportunity.

Sunday Sales Series – Utility Scale Wind O&M

Sunday Sales Series – Utility Scale Wind O&M

How much does a wind operator spend on a wind turbine per year? I posed this question to 3 of the largest wind operators in North America.

Here was the range of feedback:

That is a very loaded question as it completely depends on the breadth of scope for turbine O&M on the wind side.

It truly depends on the owner and what sort of approach they take to monitoring and maintenance

Here are the below costs that roll into an annual wind O&M

  • Preventative Maintenances
    • Types of Preventative Measurement: Hands-on vs. Software
      • Hands-on: Some O&M providers are very manual. These firms perform inspections on their fleet every year or every 2 to 3 years. These include blade inspections, gearbox inspection and bearing boroscopes. This level of hands-on inspection is pretty unusual.
      • Software: more firms are adopting technology solutions to handle the scale of assets and projects. These softwares include performance monitoring or condition monitoring systems
  1. Depending on the age and technology and method of measurement, a preventative budget can range from around $5K to $15K per turbine per year. In the low-tech operator this is budgeted hours of a technician. In the hi-tech world these are sensors and software solutions. Drones and aerial tech are used frequently in both groups.
  2. Corrective Maintenances
    • Nobody ever knows what can go wrong with these turbines so it can be anywhere from $0 – $60K per turbine per year on average. And on the very high end, if a blade needs to be replaced, this can be up to $400K in a given year! The $0-60k annual average range includes the labor and some portion of the parts but if a repair is sizable the cost associated with corrective maintenance can grow quickly. This is why preventative maintenance is so important.
  3. Warranties
    • GE and Vestas will charge an owner in the $30,000 – $75,000 range per turbine per year for the full wrap of the turbine.

Market Sizing: There is big money in wind O&M. In the next 3-5 years there will be nearly 100,000 wind turbines operating in the US. At $15,000 per year in preventative maintenance that is a $1.5 billion annual market. And at $60,000 per year in corrective maintenance that is a $6 billion annual market. My estimate is that software or digital products represent about 1/3rd (and growing) of the preventive market and about 1/10th (and steady) of the corrective maintenance market.

Net, annually I expect that software and digital products currently represent a $600-700M annual US market opportunity in wind O&M. And this figure is growing to a $1.1 billion opportunity in the next 3 years.

Sunday Sales Series 3 – Utility Scale Solar O&M

Sunday Sales Series 3 – Utility Scale Solar O&M

This will be a 4-part mini-series on utility scale O&M. There are 4 different types of O&M where standardization is occurring:

  • Utility Scale Solar: priced per MW
  • Utility Scale Wind: priced per turbine
  • Utility Scale Distribution: priced per pole, or per mile inspected
  • Still developing segments: battery O&M; utility-owned rooftop O&M

I am starting in O&M as these prices are the most standardized. After this 4-part series I will get into utility scale construction contracts for these assets. And will end with development costs, as the development stage still has very little consistency and is where the largest value arbitrage still exists for software providers.

Part 1: Utility Scale O&M – 🌞 SOLAR ☀️

The average utility scale solar site is massive. 1 MW solar capacity site takes up about 2-4 acres. A few years ago a 100MW solar site would have been award-winning. But now renewable energy developers are routinely developing mammoth solar sites between 400MW to 1 GW+ in size.

As a result of the the increase in scale, a utility scale solar farm will sprawl between 300 to 3,000 acres. The size of the projects require new technology solutions.

How did O&M inspections use to happen?

Techs would walk a site every year. They would inspect each panel with a thermal imaging ray gun and look under each panel to make sure a wire routing to the inverter wasn’t busted or eaten by a pesky animal. For a 100MW site, two techs would cover the asset twice annually. Not only is this incredibly inefficient, but the remote conditions actually make for unsafe work environments.

The above photo is captured from a drone that has a thermal camera attached. The thermal camera immediately informs a pilot and operator which panels are not operating correctly.

The FUTURE

A drone’s ability to cover massive amounts of land in relatively short time periods, all while allowing a pilot to be more secure has made the product a perfect fit for the renewable energy industry.

For sake of simplicity, I am going to use a 100MW solar site as an example. (About 300 acres in size) Most operators of renewable scale solar are looking for monthly inspections. And the price range for a fully-baked service is around $300 per MW per year. This breaks down into:

$300 per MW * $100MW site = $30,000 drone pilot & drone-related aerial analytics

While most large-scale operators are now building their own drone fleets, the cost above assumes an outsourced drone pilot. A drone pilot for that scale is about $500 per flight: so 12 flights is $6,000 for the year in drone pilot costs. Removing this $6,000 from the $30,000 per site opportunity yields approximately $24k in revenue available to the aerial analytics platform powering the solar inspection, or about $240 per MW/year.

In 2020, analysts expect over 12 GW of utility scale solar to be installed in the US. This growth equates to $3.6M in new aerial analytics software contracts becoming available as these new utility scale solar farms energize in 2020.

Given how comparable the unit of pricing is here, there has been incredible competitive pricing pressure in this figure over the past 2-3 years. Aerial analytics firms focused on O&M in renewables used to get $600+ per MW flown. For this reason, I suspect we will continue to see this O&M price drop down closer to $50-100 per MW annual pricing on the O&M side.

The upside, of course, is that even at this reduced pricing a 1 GW site still creates a $50-100k/year software opportunity.

Rockwell Automation: M&A Ready, Set, Go

Rockwell Automation: M&A Ready, Set, Go

The purpose for this (and other upcoming) analysis is to highlight the traditional industrial technology firms that are re-accelerating growth through M&A. Hopefully this information is useful to start-ups that address the industrial technology market. Over the next few weeks, I will be highlighting the top 3 firms, beginning today with Rockwell Automation.

Rockwell Automation is a Wisconsin-based industrial automation and information firm with over 23,000 employees across the globe. The company has $6.5 billion in annual sales, 40% gross margins, and approximately $1.5BN in EBITDA. Those financials earn the firm a market cap of $26 billion dollars and enterprise value near $30 billion. This means Rockwell trades at 4-5x revenue, and 20x EBITDA. Here is their 2019 Investor Presentation.

As detailed below, my high ratings for Rockwell are due to their well-structured focus on infusing new technology’s into their business. Here are the 3 parameters:

Aligned and Simplified Business Units: 5/5

Clear M&A Goals, with Recent Examples: 5/5

Clear Channel Partner / Minority Investment Goals, with Recent Examples: 5/5

Aligned & Simplified Business Units

Rockwell used to have a maze of different business units. Now they have simplified their business into 3 segments: hardware (connected devices); software (software & control) and services (lifecycle services). As shown below, they now also clearly detail the products in terms of functionality, making it easier for customers and partners to identify the best internal champions.

Clear & Consistent M&A Goals, with Recent Examples

Unlike most firms, Rockwell actually specifically calls out that they intend to grow topline revenues through inorganic means. Inorganic = addition through M&A! And, they indicate both how much they want to add and in what groups. This feedback to the market is very rare.

This chart shows that Rockwell is looking to add 1% of growth per year from M&A. Since the company has $6.5 billion of revenue, this means that Rockwell is looking to add $65-100M in revenue from acquisitions each year. And combining this page with the earlier “segments” image, Rockwell makes it clear that they are targeting a company (companies!) with focus in:

  • Information Services: MES software, data analytics, IoT visualization, Augmented Reality, Device & Enterprise Security
  • Connected Services: Remote monitoring, Network & Security, Safety Services, Infrastructure-as-a-service

There is no hard & fast rule, but using their own guidance, it looks like Rockwell is acquiring software and systems controls businesses when they hit revenues at/near $50M levels. Kalypso is software and services focused and ASM is an industrial technology firm.

What about valuation? Industrial technology firms don’t like to pay high acquisition multiples. These slower-growth businesses tend to be valued off of EBITDA. As indicated earlier, Rockwell trades around 20x EBITDA. However, Rockwell is trying to change their narrative to a more growth story. And in either case, higher multiples can be done when an industrial technology behemoth believes that they can bolt-on the software business and immediately increase distribution at a relatively low marginal cost. I have seen a $30M software business with no EBITDA get purchased by an industrial technology firm do $100M the next year and $40M in EBITDA. When a firm like Rockwell sees this ability to leverage existing distribution with a new product, they will pay premiums. The recent OSI transaction also shows industrial technology companies are willing to pay 10x revenues. Given those frameworks, a $50M software revenue bolt-on could be valued at/near $200-600M+, depending on the availability of those synergies.

Notably, Rockwell Automation also makes BOLD bets when they invested a $1 billion minority equity investment into PTC.

Clear & Consistent Channel Partner, Minority Investment Goals

There is less detail available on channel partnerships and recent investment examples. On Pitchbook, there are 3 public venture / JV-related investments:

Claroty: OT / IoT cybersecurity platform. This looks to fit within Information Solutions: Device and Enterprise Security. Rockwell joined a $60M growth round.

Sensia JV: Provider of digital oilfield solutions from well to terminal. Rockwell paid $250M to own 53% and Schlumberger still owns 47%. This is an example of visualization software that fits within the Information Solutions vertical – and can be classified as inorganic growth.

Atom Power: Developer of digital and programmable circuit breakers designed to democratize commercial and industrial power distribution. This fits somewhere between Intelligent Devices and Software. Rockwell joined a minority, growth round.

The company also has larger scale partnerships to help with distribution, solutions and equipment, as seen below:

In Summary

Very few firms provide such context on their intent and area of focus for inorganic growth. Rockwell makes it pretty clear: acquiring at least $250M of revenue derived mostly from industrial software businesses over the next 3-4 years. The business units are simplified and the areas of focus for growth are well-defined. I expect Rockwell to be an active player in industrial technology M&A over the coming years. High growth start-ups in the space should develop relationships accordingly…

Sunday Sales Series – Rooftop and Community Solar

Sunday Sales Series – Rooftop and Community Solar

Last week I covered commissions and take-rates on retail energy products.

Today I am covering the next level of consumer energy products:

  • rooftop solar
  • community solar

As you will see below, the payouts for these two products are the highest in the energy market. Why? The payouts have to compensate the platforms for the high cost of capturing and educating customers on energy options, a topic that is considered by consumers for a whopping 6 minutes a year.

Therefore, many energy platforms are either:

1- widening the funnel by pairing with other home services related products: digital home products like security, connected devices, real estate brokers. The goal here is to have the energy product be a bolt-on purchase in the purchasing discussion.

2- looking to “pull up” customers from more entry level energy products, like retail energy, Nest thermostats, or HVAC relationships. The goal here is to capture the customer when an energy professional can quickly quantify the savings and resilience benefits of these energy products.

Rooftop solar

The costs for rooftop solar have declined dramatically over the past decade. However, most of those costs have come from the hardware and “Balance of Materials” (BoM). But customer education and acquisition costs have barely declined in the same period. While many firms are trying to go to digital engagements, most of the customer acquisition in this industry is hand-to-hand combat. This involves door knocking, out of home education and long sales closes.

These costs are sufficient to create a lucrative business for a digital platform to make real revenues.

Solar is installed on a size basis: the average rooftop installation in the US is around 6-7kW. And a 6 kW system is about $15,000 fully loaded cost to a customer, pre-tax. In the origination market, you can get paid for a qualified lead or for a fully delivered customer. (Fully delivered meaning you get paid upon installation.) Most of the market has moved from lead to installation.

They payout figures in market are around $200-300 per kW installed. This means that for the average US installation a platform that helps originate and qualify a residential solar customer will get paid between $1,200 to $1,500. At ChooseEnergy, there was a year where we were the largest online originator of rooftop customer solar customers. Since we had an extra exposure on Texas and the northeast, our average installation was 9 kW so we were clipping around $2,000+ per customer.

Community Solar

Community solar is when a customer buys a portion of a (usually) nearby solar farm. Large, utility-scale solar farms look for long-term Power Purchase Agreements (PPA) whereby the credit of the off-taker can be used to help finance the near-billion dollar projects. The off-taker in those utility-scale cases are Fortune 500 companies with big balance sheets.

Community solar is usually designed for smaller scale counter-parties: municipalities, smaller utilities, group buyers. Recent business model innovation now allows for traditional residential or commercial buyers to buy a share of these community solar sites. But the asset owners themselves still need longer-term, high credit commitments from their homeowner purchasers. One of the beauties of community solar, however, is that a homeowner who can’t purchase rooftop solar can purchase community solar. This opens up the market to apartment dwellers or homeowners with excess tree coverage /whose roof faces inopportune directions.

Due to the need for a 5+ year contract commitment and high credit consumer, the education and friction to acquire these consumers is high. This usually means that the community solar provider is willing to pay around $50 per year per kW of off-take meaning around $300 per year of contract signed, or around $1,500 per new customer if a 5-year, standard contract.

The companies in this space include

EnergySage: rooftop solar origination platform; exploring adding batteries

Arcadia Power: Green renewable energy credits to your utility bill w the goal to upsell to community solar products

PickMySolar.com and Solar.com – Solar qualification and origination platform; also adding battery solutions

Solstice: Community solar origination platform

Wattbuy: Retail energy acquisition platform with natural goal to expand into rooftop and community solar origination

Sunday Sales Series – Retail Energy Contracts

Sunday Sales Series – Retail Energy Contracts

Today’s sales topics are going to cover the commissions that retailer energy providers, rooftop solar installers, and community solar firms are willing to pay to acquire residential and commercial customers:

I co-wrote this post with Jonathan Crowder. And before getting to the numbers, w need to define a few key terms:

Originators: In the energy space the main forms of customer acquisition remain offline brokers. These brokers operate through door-to-door sales, outbound phone sales, and other traditional sales techniques. Online origination through state sites, comparison sites, energy websites and connected home /clean energy brands are the fastest growing form of customer acquisition

Upfront: the amount that an energy firm is willing to pay upon confirmation of a customer’s enrollment. The energy firm usually pays this spiff upon receiving the customer’s payment information – or upon the the payment of the first month’s energy bill.

Residual: the % of the supply portion of the energy bill that an energy firm is willing to pay the originator for as long as the customer stays with the energy firm. This payment option is more specific to retail energy and is meant to incentivize the originator to not keep flipping the customer to another provider every time the customer contract comes up for renewal. These payments are done monthly, in arrears, and are usually tied to the size of the customer’s energy bill.

A “mil”: In the energy compensation narrative, a mil refers to Is 1/1,000th of a US dollar, or 1/10th of a cent. This is important to know because the “mils” are how energy providers create business alignment with originators. The mil is used to calculate how much an originator earns in monthly commissions. For example, if a small business uses 10,0000 kWh of energy per month, and the originator agreed to a “5 mils” contract, then the originator gets paid a monthly amount of (10,000 kWh * $0.005 dollars per kWh)= $50 per month of commission.

Contract Term: Like a cable bill or your phone plan, many energy contracts can range from prepaid monthly plans to 3, 6, 12 or 24+ month contracts. Some community solar contracts are 5 years, or more! And a rooftop solar contract is ultimately tied to the house (vs the homeowner) and can be 20+ years long. Like with other home services products, terminating a contract early likely results in a pre-payment penalty.

Renewal: At the end of a contract, customer’s can either roll over into a new plan with their existing energy supplier or search for a new firm.

Rate: The amount, usually charged per kWh (just like your utility bill), that you pay for energy. It is important to note that there are different prices, depending on the portion of the energy bill you are covering. Some firms (retail energy providers, community solar) may just be substituting out the supply portion of your energy bill. Other offerings, like rooftop solar, may include both supply and broader distribution charges as part of their rate.

SALES CONTRACTS

Since we are talking about a commodity here any additional margin paid to a broker is very simply added to the underlying rate. If a retailer is pricing energy at 10 cents and you want to make a penny of margin as an originator, they will simply allow you to Mark the rate as 11 cents in your reseller agreement. The problem with this structure is that the least informed customers can pay very non-standard rates if they are sold hard by a broker. I have heard horror stories where offline brokers charges a 50% premium to the underlying commodity.

Thankfully, digitall experiences are bringing better experiences. And there is greater consistency to what online brokers are able to charge, and therefore able to pass along to the consumer. Here they are:

Residential consumer, Texas: $125 upfront 2-3 mils. The average texas home consumes around 15,000 kWh so the retailer is willing to pay up to $175 for the first year of contract and about $50-75 per year thereafter.

Residential consumer, non-Texas: $75 upfront and 2-3 mils. The average US home outside of Texas consumes about 10,000 kWh so these accounts are smaller and usually less profitable. This results in about a $100 first year payment and $30-40 annual value thereafter.

One of the most ludicrous part of this energy experience is the equivalent “rake”. At best, a customer can expect to save around $50-75 a year by choosing a retail supplier that isn’t their own utility. And the retailers pay nearly double that to acquire a customer. The cost to educate and acquire a customer is at least 2x the savings – so the system is mostly broken.

Commercial consumer: standards are variable but usually ranges from 3 to 10 mils depending on the size of the account. At Choose we had a lot of small accounts (restaurants) who were around 30,000 kWh per year so they would pay us about $150 per year at 5 mils. Once we had a huge warehouse in the Port of NJ sign up through our site at 10 million kWh+ annually and we made tens of thousands of dollars each year on one meter. This range shows how variable the commercial market can be in the supply arena. It is these big accounts where offline brokers focus and try to add large broker fees to make mega-commissions and a lot of the “fat” still lives in the system.

Bill Gurley famously covered the different “rakes” of online platforms. Online sites commissions range from ~3-30%. In retail energy, if the average rate is 10 cents supply, then the originators are taking about a 5% take- pretty low. However, if you take into account that this is a commodity with lower margins, at these commissions the originators capture as much as 50% of the profit. And that is the real apples-apples comparison here.

Next week we will cover “green retail plans”, community solar and rooftop solar origination figures. I will also cover how retail suppliers coordinate to monetize on the broader connected home opportunity.

Matt Ridley’s Newest Book Covers… ENERGY Innovation!

Matt Ridley’s Newest Book Covers… ENERGY Innovation!

Matt Ridley is the author of a number of award-winning books. Notable hits include The Evolution of Everything and How Ideas Emerge. My personal favorite of his is The Rational Optimist. One of the many reasons I enjoy Matt’s writing is his ability to deconstruct complex outcomes to their foundational drivers.

I am working on a longer-form paper that details some of the emergent behaviors of technology in the energy and industrial transition. In the research process I have engaged a number of complexity and platform leaders. One of those leaders, the esteemed VC Bill Gurley of Benchmark, pointed me to Matt Ridley’s latest book, How Innovation Works and referenced that there is actually a section on energy innovation. Well, one week later and I have covered the book and am happy to give it a ringing endorsement. Whether you are new to energy or an experienced pro, you will learn something new. And, classic to Matt Ridley, he frames energy innovation in a refreshing way.

My Favorite Themes, Quotes & Takeaway from the Energy Section

Theme 1: Failure is the father of Innovation

Innovation is itself a product, the manufacturing of which is a team effort requiring trial and error.

Edison called his work “the invention business”. “He remained relentlessly focused on finding out what the world needed and then inventing ways of meeting the needs…his method of invention was always trial and error. In developing the nickel-iron battery his employees undertook 50,000 experiments. (!!)

“Inventing is 1% inspiration and 99% perspiration”

Theme 2: Innovation is Inevitable

I am fascinated by how technology inventions seem to converge at a specific point in time. And particularly how this convergence occurs after extreme technology advancement and trial/error reminds me a lot of Michael Waldrip’s Complexity. The technologies that enable a transformation are all advancing independently AND interacting with each other. Add in a number of entrepreneurs, acting as catalysts, and suddenly new structures emerge at the “edge of chaos” that result in a new, higher order of efficiency. This arrival to a ‘higher order’ occurred with the lightbulb, and looks a lot like what is happening today with the interacting forces driving a digitized and decentralized energy network.

“Simultaneous invention marks the progress of technology as if there is something ripe about the moment. It does not necessarily imply plagiarism. In this (steam engine) case, the combination of better metalworking, more interest in mining and a scientific fascination with vacuums has come together.. to make a steam engine almost inevitable.”

“The lightbulb emerged inexorably from the combined technologies of the day. It was bound to appear when it did, given the progress of other technologies.”

Theme 3: Innovation Turns Ideas into Practical, Reliable and Affordable Reality

There is a difference between invention and innovation. According to the book, innovation is how famous names like Thomas Edison rise to the top of the 21 inventors who lay claim to inventing the lightbulb. Edison was focused on innovating and specifically on reliability as he tested over 6,000 different filaments for duration and cost.

The ability to take a technology invention and gradually (through testing) get to a customer-available product is where innovators stand out.

Theme 4: Innovation in Energy is Evolution, not a Series of Revolutions

“Long after the key technologies had been invented, innovation continues.”

The first turbine was 2% efficient and today a combined cycle gas turbine is 60% efficient. This 100+ year journey was a collaborative effort with no 1-time transformations. Innovation came from small steps of experts, testing along the way.

The book then also explains why certain atomized production processes improve. And then goes into great detail on how other large scale projects, hampered by the rising costs for regulation, begin to dis-innovate. This is my favorite line:

“Nuclear is ill-suited to the most critical innovation practices: learning by doing. ” The best products leverage subject matter experts to tweak and innovate along the way. The experts find a way to test, iterate and improve. This testing happened successfully with shale gas exploration and fracking: west Texas wildcatters who had small companies were able to buy mineral rights from land owners and were more nimble to do small tests. In other, more regulated oil & gas countries, this innovation could not persist as the state/country owned the land rights.

What this Means TODAY

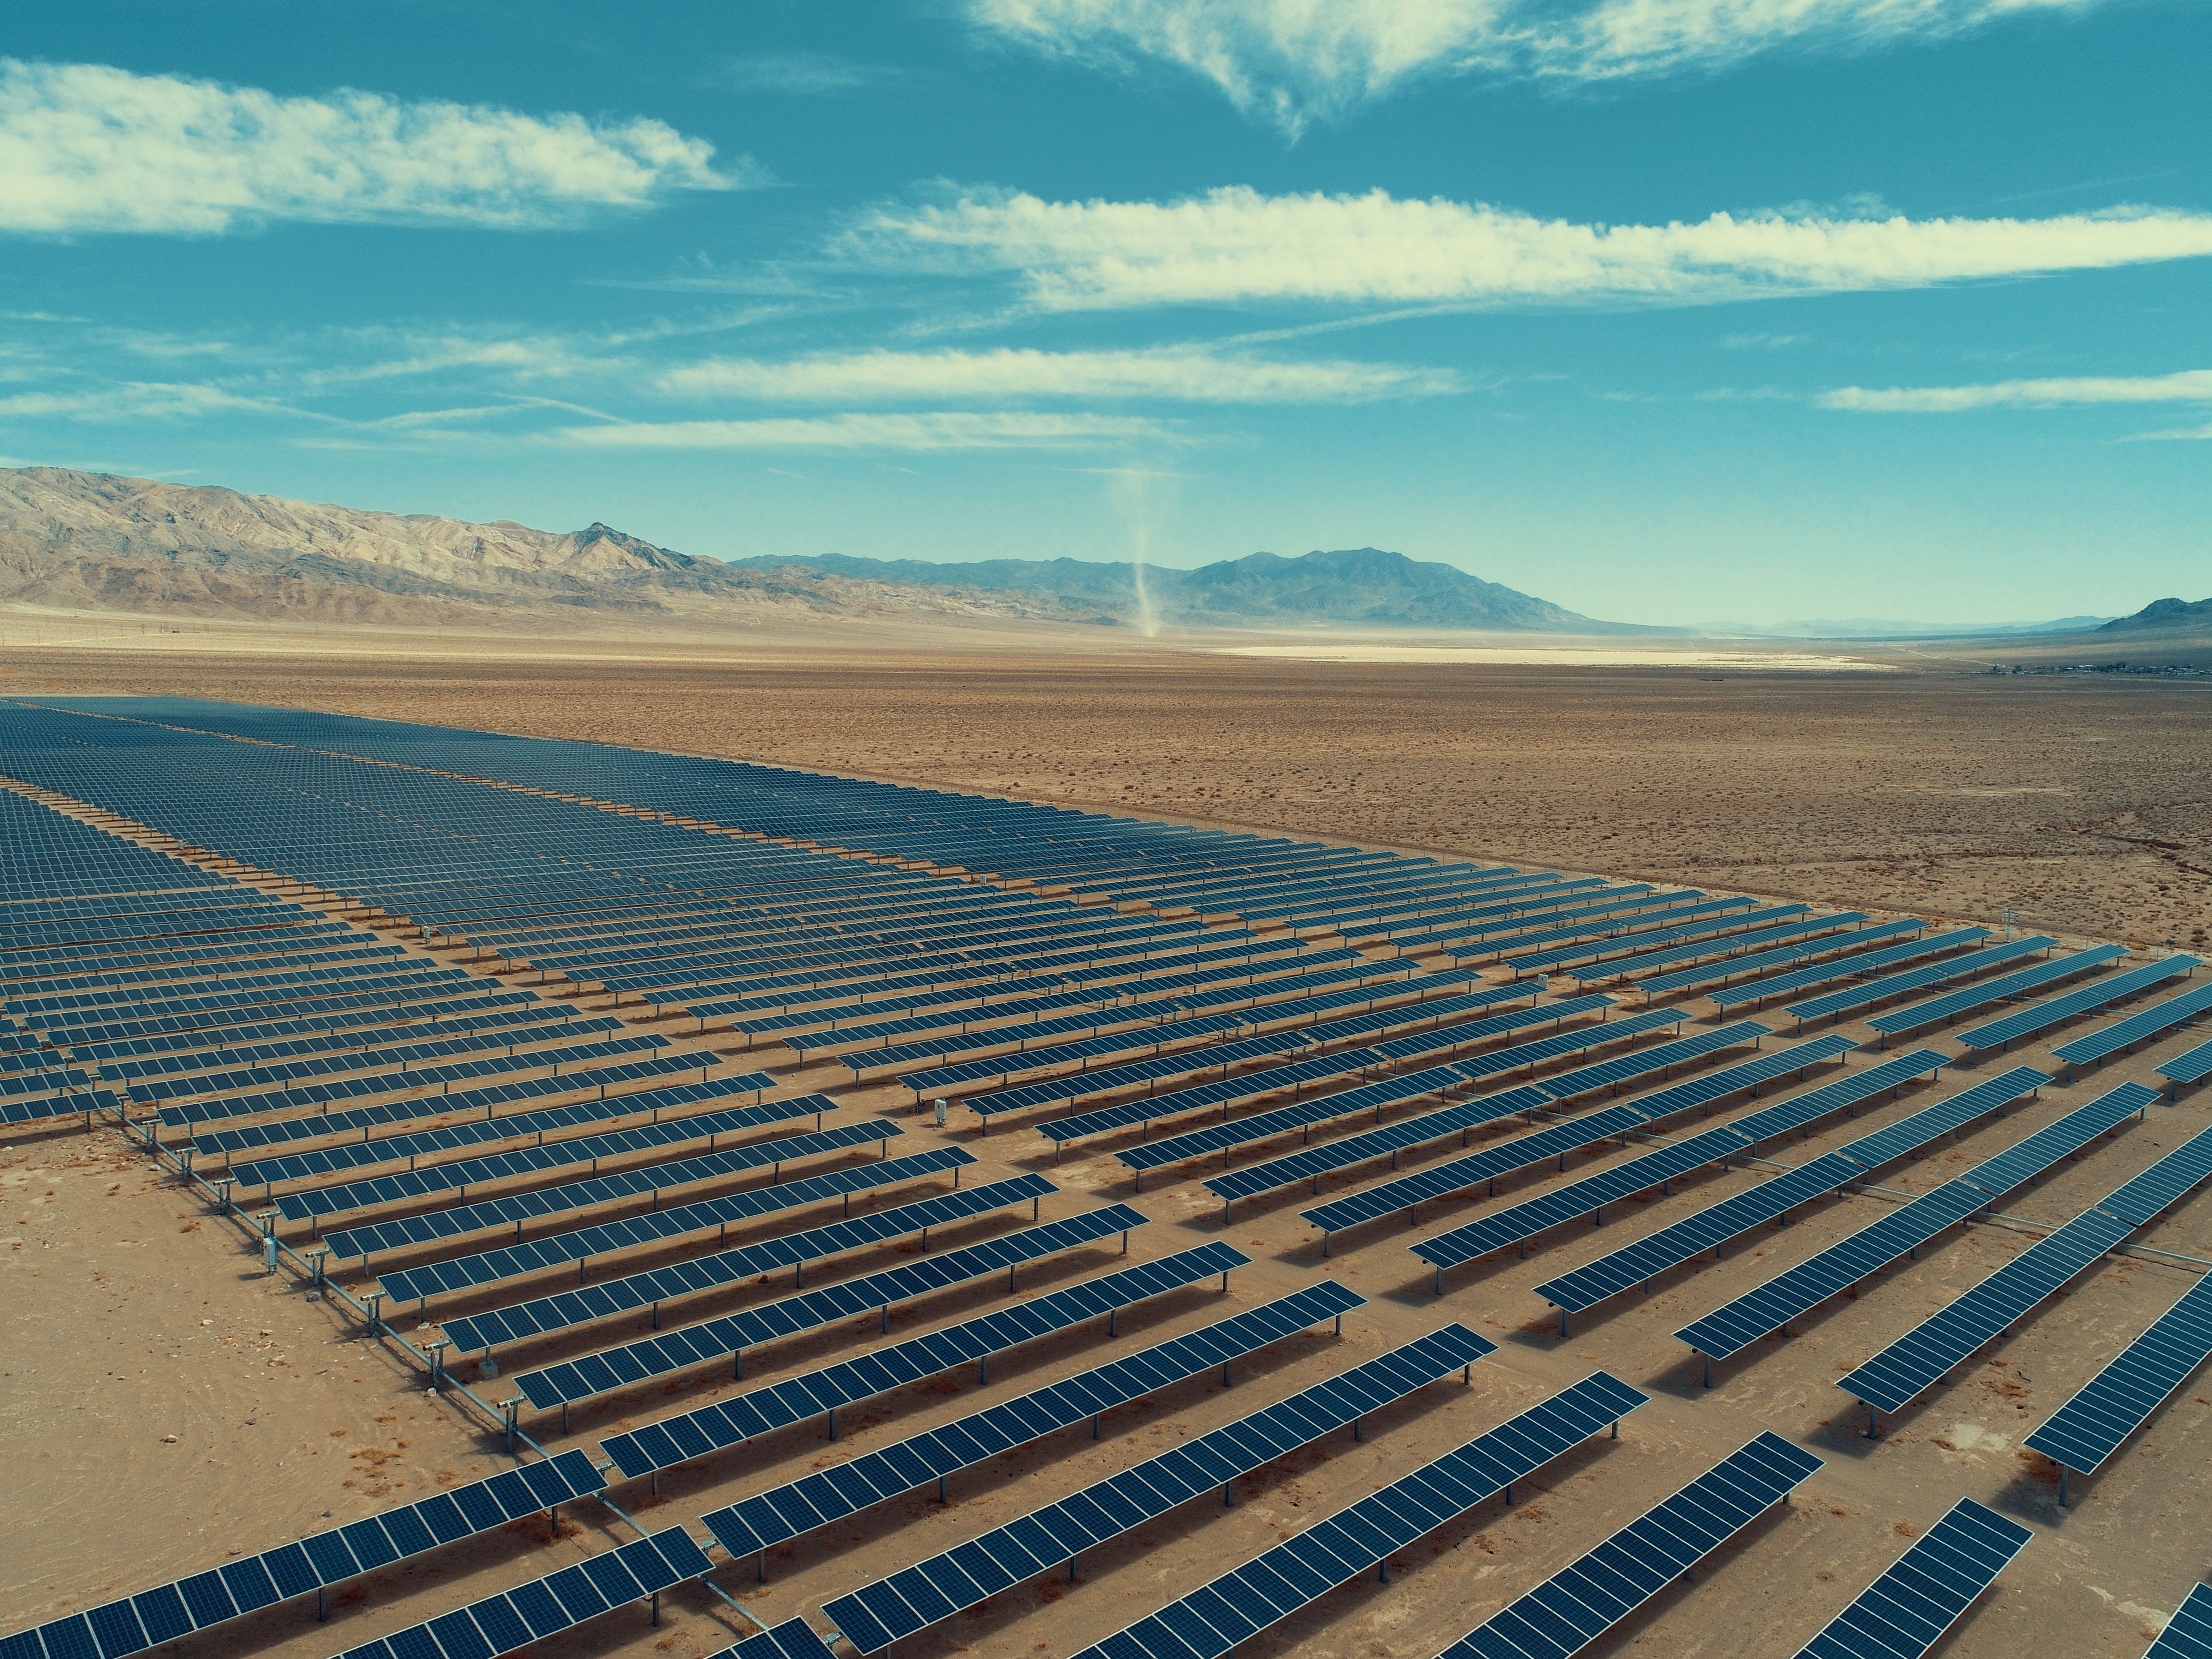
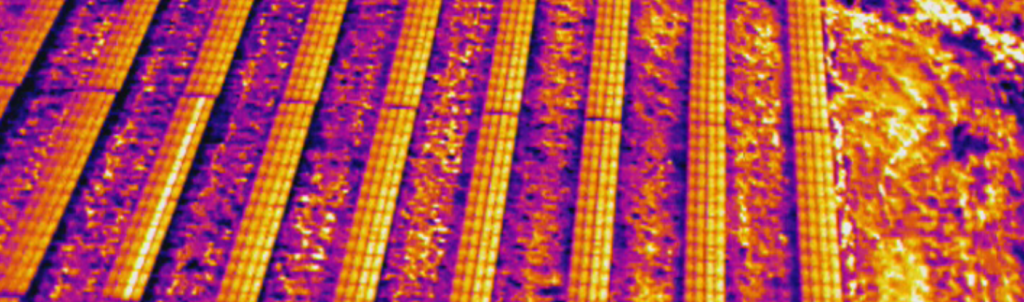
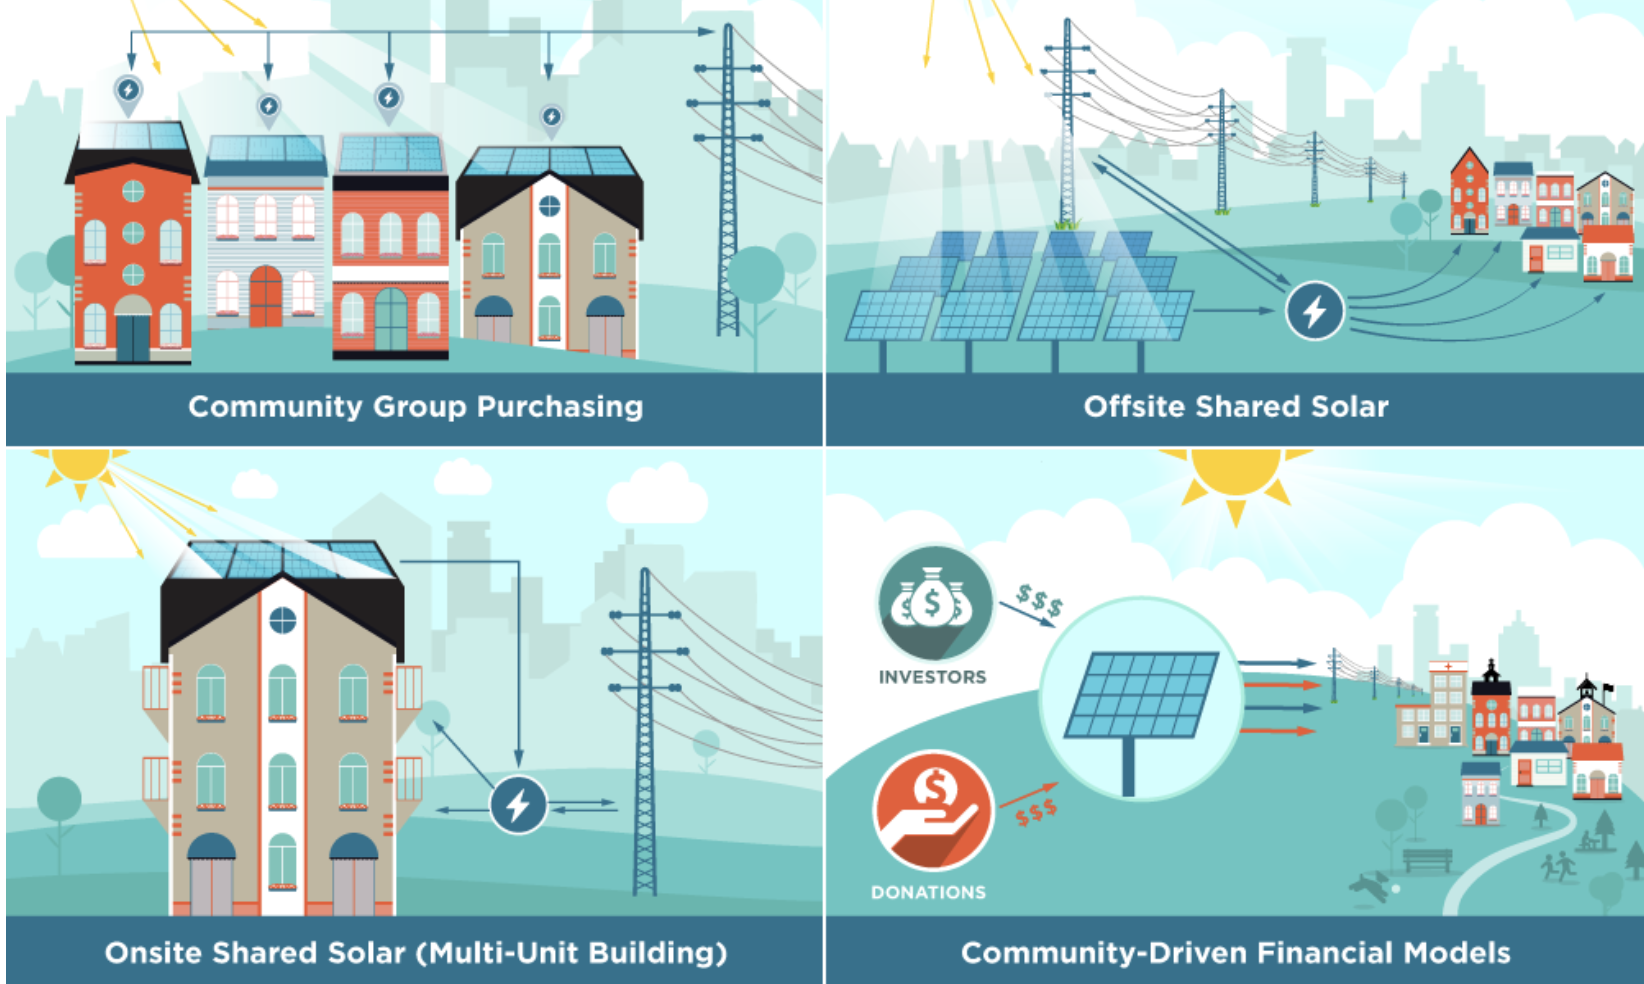
The installed bases of new energy technologies is gaining critical mass: wind, solar, batteries, EV charger. Wind and solar have gained efficiencies over the years: wind OEMs have made increasingly aerodynamic and larger blades alongside improved gearboxes and materials costs; solar is improving absorption rates and further accelerating efficiency through better inverters, trackers and 2-sided panels. In addition to the hardware, operators are getting better at O&M as they leverage remote communications network, drones, and predictive analytics. All of these continued innovations are consistent with the slow & steady march towards record-setting productions levels.

This installed renewable base coupled with advances in data products, connected devices, and software management, are apt to create a new wave of simultaneous digital advancements. These software solutions will not only accelerate the efficiency of these verticals but improve interoperability with the operating environment. As a result, we are likely to see innovative customer behaviors as these energy consumers adapt to the new product suite available. While fantastical now, these prospective new products and behaviors will seem like inevitable advances in the near-future. How fortunate are we to have the march of innovation?

Summary

In How Innovation Works, Matt covers other verticals Public Health, Transport, Food and Communications. Then he pivots to more horizontal themes such as the economics of innovation, and identifying fads and frauds. He ultimately wraps up with how to get around (the expected) resistance to innovation and which cases are worth fighting. Again, go buy the book – the perspective is clarifying and refreshing.