Rockwell Automation: M&A Ready, Set, Go
The purpose for this (and other upcoming) analysis is to highlight the traditional industrial technology firms that are re-accelerating growth through M&A. Hopefully this information is useful to start-ups that address the industrial technology market. Over the next few weeks, I will be highlighting the top 3 firms, beginning today with Rockwell Automation.
Rockwell Automation is a Wisconsin-based industrial automation and information firm with over 23,000 employees across the globe. The company has $6.5 billion in annual sales, 40% gross margins, and approximately $1.5BN in EBITDA. Those financials earn the firm a market cap of $26 billion dollars and enterprise value near $30 billion. This means Rockwell trades at 4-5x revenue, and 20x EBITDA. Here is their 2019 Investor Presentation.
As detailed below, my high ratings for Rockwell are due to their well-structured focus on infusing new technology’s into their business. Here are the 3 parameters:
Aligned and Simplified Business Units: 5/5
Clear M&A Goals, with Recent Examples: 5/5
Clear Channel Partner / Minority Investment Goals, with Recent Examples: 5/5
Aligned & Simplified Business Units
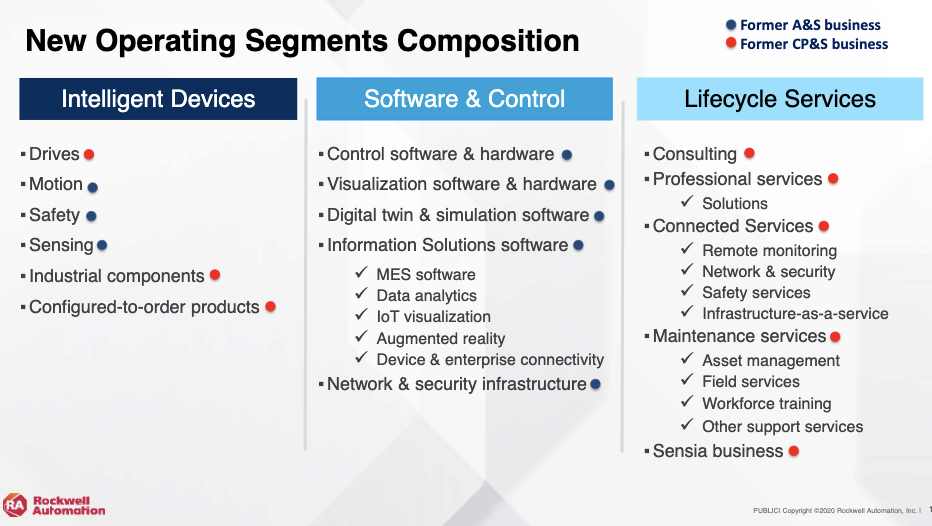
Rockwell used to have a maze of different business units. Now they have simplified their business into 3 segments: hardware (connected devices); software (software & control) and services (lifecycle services). As shown below, they now also clearly detail the products in terms of functionality, making it easier for customers and partners to identify the best internal champions.
Clear & Consistent M&A Goals, with Recent Examples
Unlike most firms, Rockwell actually specifically calls out that they intend to grow topline revenues through inorganic means. Inorganic = addition through M&A! And, they indicate both how much they want to add and in what groups. This feedback to the market is very rare.
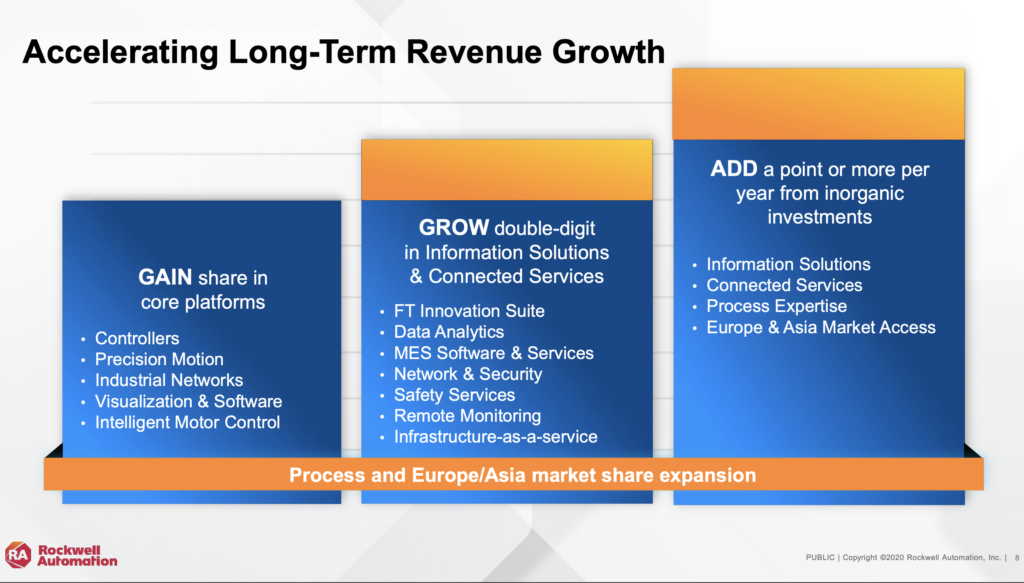
This chart shows that Rockwell is looking to add 1% of growth per year from M&A. Since the company has $6.5 billion of revenue, this means that Rockwell is looking to add $65-100M in revenue from acquisitions each year. And combining this page with the earlier “segments” image, Rockwell makes it clear that they are targeting a company (companies!) with focus in:
- Information Services: MES software, data analytics, IoT visualization, Augmented Reality, Device & Enterprise Security
- Connected Services: Remote monitoring, Network & Security, Safety Services, Infrastructure-as-a-service
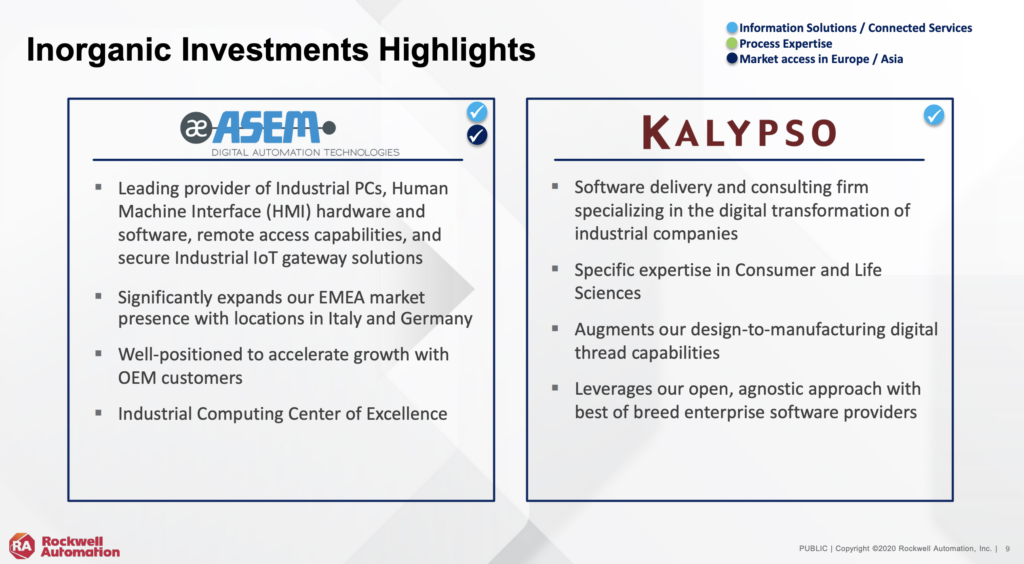
There is no hard & fast rule, but using their own guidance, it looks like Rockwell is acquiring software and systems controls businesses when they hit revenues at/near $50M levels. Kalypso is software and services focused and ASM is an industrial technology firm.
What about valuation? Industrial technology firms don’t like to pay high acquisition multiples. These slower-growth businesses tend to be valued off of EBITDA. As indicated earlier, Rockwell trades around 20x EBITDA. However, Rockwell is trying to change their narrative to a more growth story. And in either case, higher multiples can be done when an industrial technology behemoth believes that they can bolt-on the software business and immediately increase distribution at a relatively low marginal cost. I have seen a $30M software business with no EBITDA get purchased by an industrial technology firm do $100M the next year and $40M in EBITDA. When a firm like Rockwell sees this ability to leverage existing distribution with a new product, they will pay premiums. The recent OSI transaction also shows industrial technology companies are willing to pay 10x revenues. Given those frameworks, a $50M software revenue bolt-on could be valued at/near $200-600M+, depending on the availability of those synergies.
Notably, Rockwell Automation also makes BOLD bets when they invested a $1 billion minority equity investment into PTC.
Clear & Consistent Channel Partner, Minority Investment Goals
There is less detail available on channel partnerships and recent investment examples. On Pitchbook, there are 3 public venture / JV-related investments:
Claroty: OT / IoT cybersecurity platform. This looks to fit within Information Solutions: Device and Enterprise Security. Rockwell joined a $60M growth round.
Sensia JV: Provider of digital oilfield solutions from well to terminal. Rockwell paid $250M to own 53% and Schlumberger still owns 47%. This is an example of visualization software that fits within the Information Solutions vertical – and can be classified as inorganic growth.
Atom Power: Developer of digital and programmable circuit breakers designed to democratize commercial and industrial power distribution. This fits somewhere between Intelligent Devices and Software. Rockwell joined a minority, growth round.
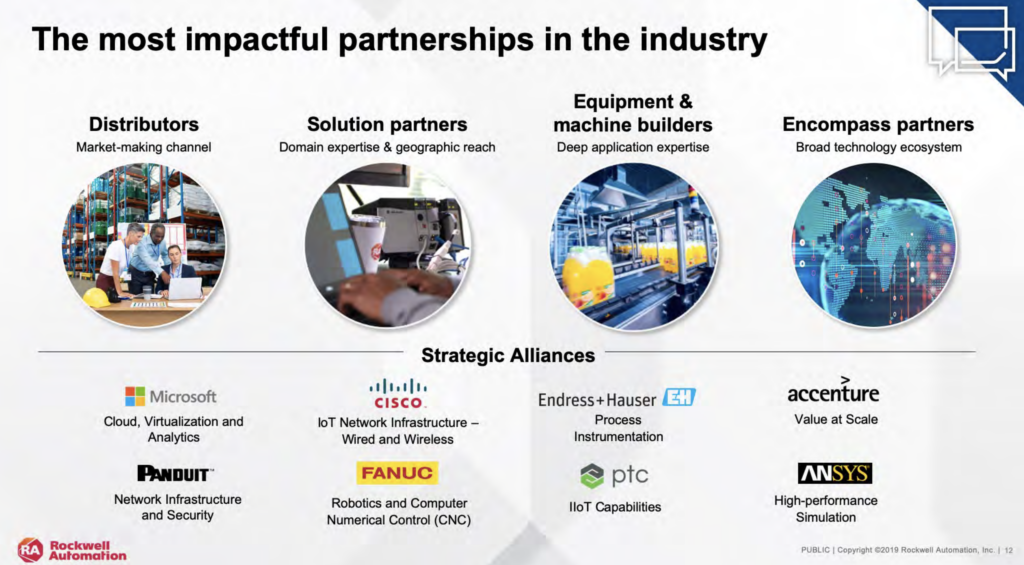
The company also has larger scale partnerships to help with distribution, solutions and equipment, as seen below:
In Summary
Very few firms provide such context on their intent and area of focus for inorganic growth. Rockwell makes it pretty clear: acquiring at least $250M of revenue derived mostly from industrial software businesses over the next 3-4 years. The business units are simplified and the areas of focus for growth are well-defined. I expect Rockwell to be an active player in industrial technology M&A over the coming years. High growth start-ups in the space should develop relationships accordingly…