
Energy Transition M&A: Is a new wave coming?
(Note: this post was co-authored with Kevin Stevens, Partner at Intelis Capital)
Much like its industrial counterpart, energy technology is broad, but in a different way. Energy has the usual two categories, enterprise, and consumer, but also contains “hard” technologies like solar and battery storage. This bifurcation along two segments creates varying outcomes.
Since the energy transition is an emerging trend, data points for exits are limited. The companies that have exited are the success stories of “cleantech 1.0”. The average Series A date in our dataset is Q2 2008 which is the heart of this era and the majority of exits occurred before the end of 2017.
Capital for energy technology largely dried up between 2009-2016, so it’s unsurprising that exits became less common as fewer companies were funded. Additionally, it’s likely the outcomes in our dataset are smaller than future outcomes as we haven’t seen many exits in today’s market which values technology even more favorably than just a few years ago. Link to analysis can be found here.
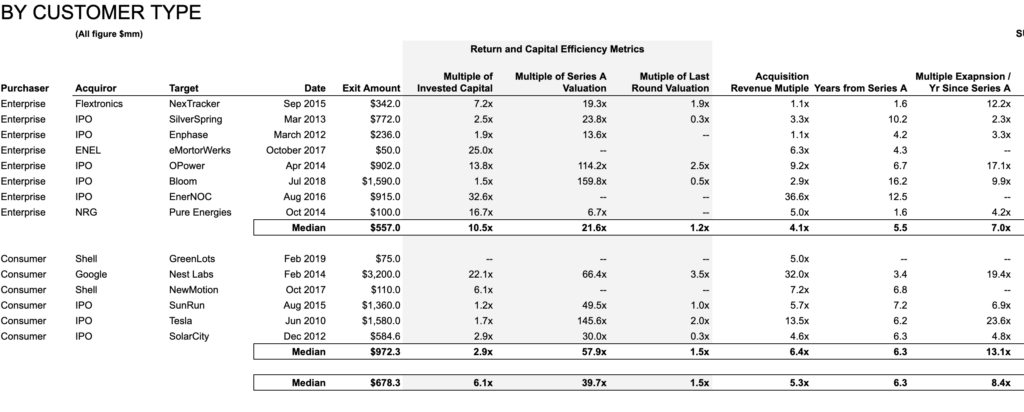
CONSUMER TECHNOLOGIES
Using the median data here’s the narrative for consumer technologies in energy (note: Tesla and Sunrun are outliers):
- A startup raises $9.6M on a ~$24M post-money valuation
- Over the next 6 years, the company raises an additional $165M in capital prior to exit
- At the time of exit, the startup has an approximate revenue/bookings of $108M for a cash efficiency of 65%.
- The company exits at $972M, meaning the average multiple is 6.4x Trailing Twelve Month revenue. And the exit price is a 2.9x multiple on total invested capital, a 57.9x return on the Series A, and a 1.2x return on the pre-exit round.
ENTERPRISE TECHNOLOGIES
Using the median data here is the narrative for enterprise technologies selling to energy companies:
- A startup raises $5.4 on a ~$16M post-money valuation
- Over the next 5-6 years, the company raises an additional $40M in capital prior to exit
- At the time of exit, the startup has an approximate revenue/bookings of $157M
- The company exits at $557M, meaning the average multiple is 4.1x Trailing Twelve Month revenue. And the exit price is a 10.5x multiple on total invested capital, a 21.6x return on the Series A, and a 1.5x return on the pre-exit round.
What are the comparative takeaways for each of these segments?
- The data points are limited, we only have 5 true exits in the consumer data set with two big outliers – Tesla and Sunrun – and only 8 documented exits in the enterprise segment. As with the industrial analysis, the larger narrative is how fell exits there are- and that the graveyard doesn’t necessarily speak the truth.
- In these companies, early-stage investors did extremely well. This makes sense since most of the Series A investors in this dataset financed product development in a category that was unproven.
- Consumer businesses require more capital to grow but also reach larger markets. As a result, they earn higher multiples and exit prices than their enterprise counterparts.
- At 16x trailing twelve-month revenue, software companies earn the highest multiple. hardware companies earn just over 5x. And a surprising narrative is that the “tweener” companies that merge hardware and software actually have the lowest multiple at 3x.
- There has been a lull in exits which makes intuitive sense. From 2007-2012, clean energy-related startups received $20B annually in new funding – that number plummeted to $3B from 2013-2017. Fewer companies funded = fewer companies to exit.
Given the average time to exit post a Series A is 5-6 years this means that the renewed funding levels in 2018 and 2019 will likely start to produce headline exits in 2023. Grab your popcorn!