In June 2007 John Doerr took stage for a Ted talk and got emotional talking about climate change. The battle was on and cleantech 1.0 momentum was in early innings.
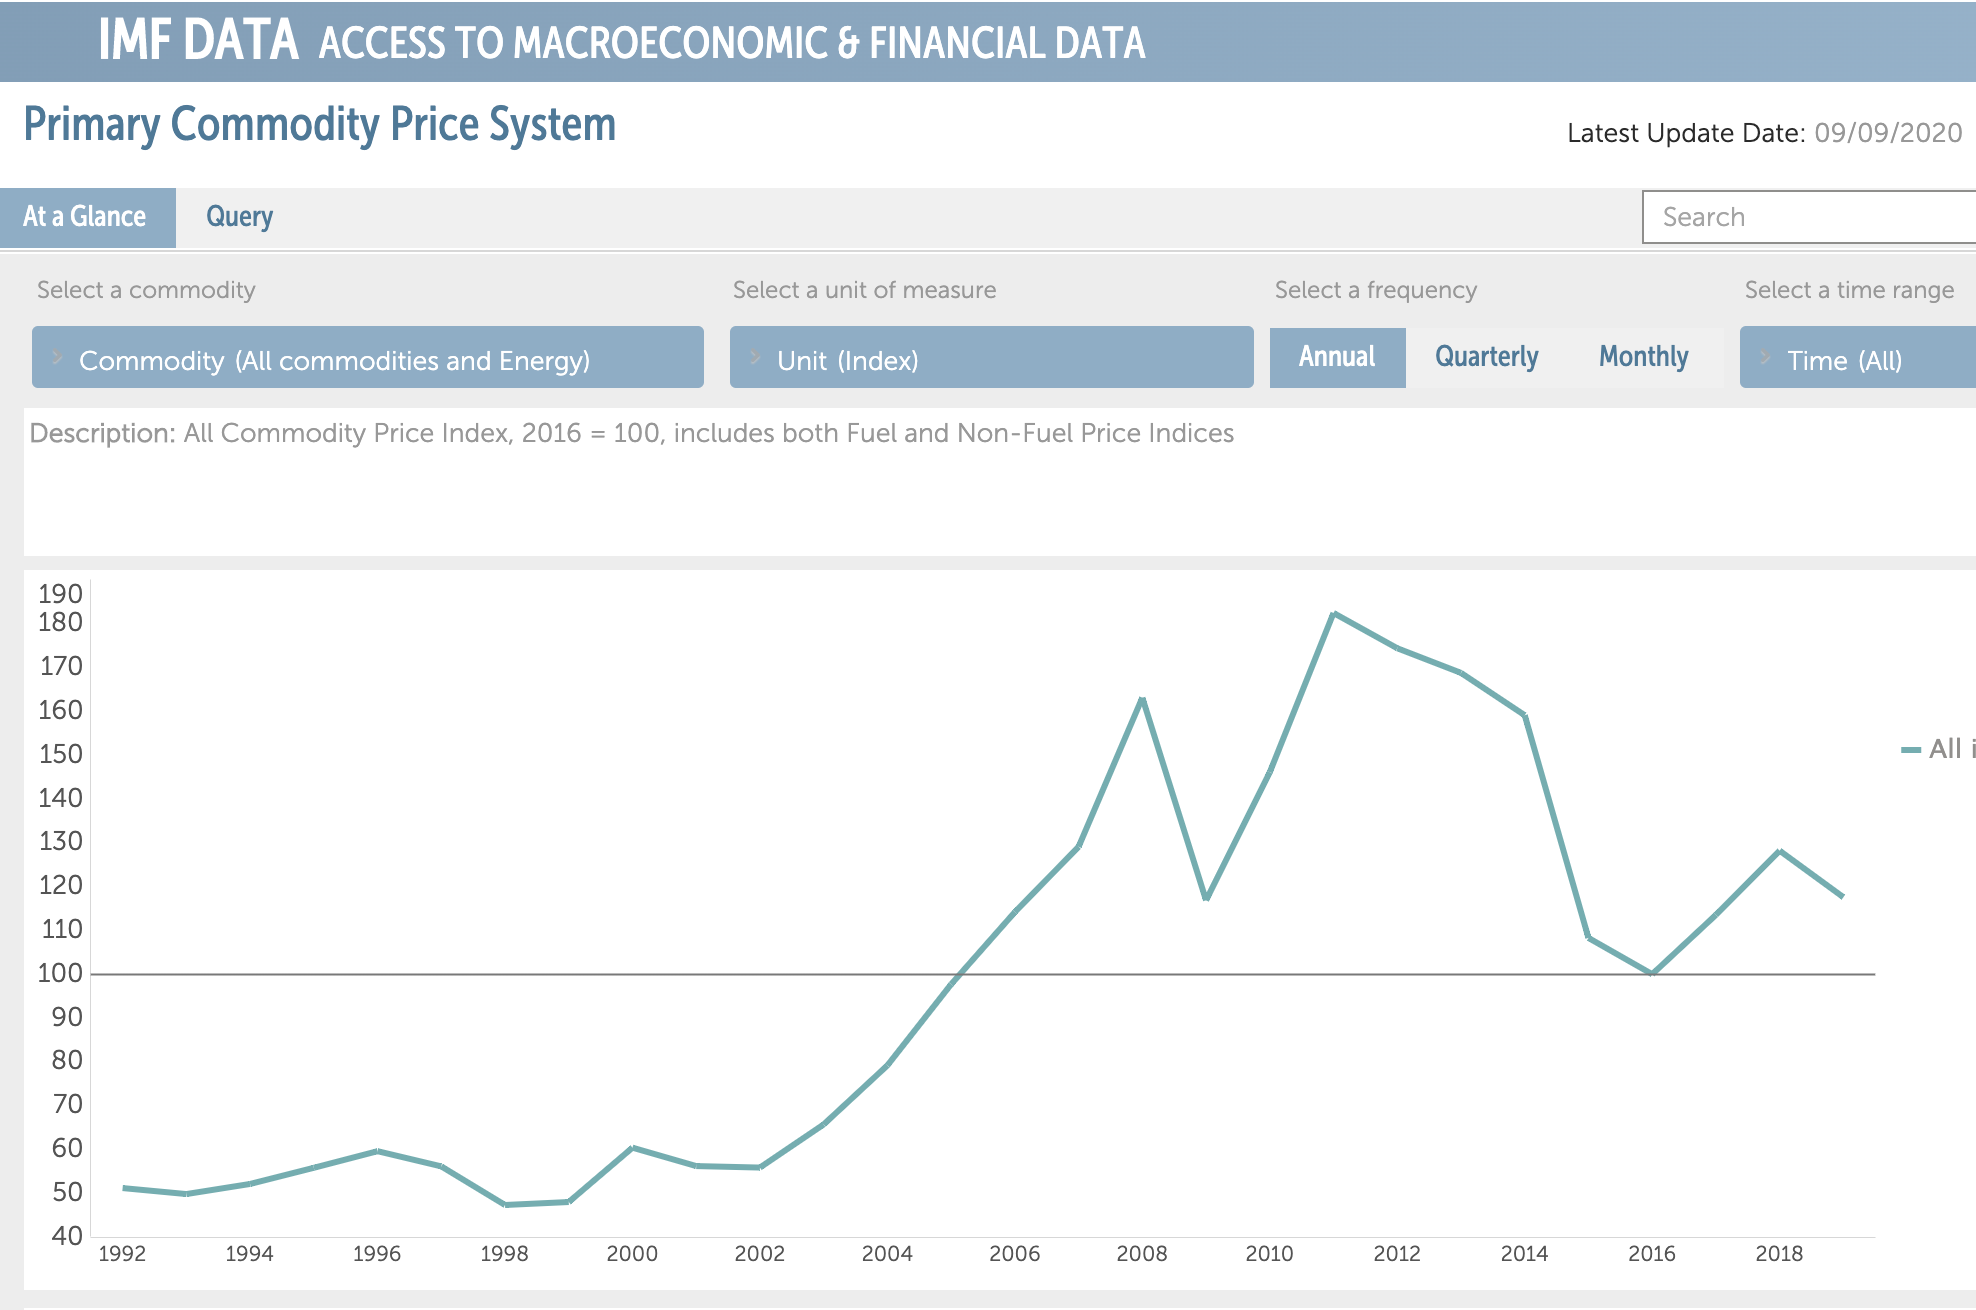
I now look back to speeches like this one, press highlights, old investment memorandums, etc. and almost EVERY message was based on price. So many investments were a hop/skip/jump away to being able to compete on price with traditional energy sources. The reason for this messaging was because commodity prices were going UP and meeting renewable alternatives at the higher cost tiers. Here is an Index chart from the IMF on global commodity prices over the past few decades.
As you can see here, cleantech 1.0 was a false front because new energy investors and operators were gaining confidence in a battle that was taking place outside of normal bounds. Therefore, when energy prices fell in the early 2010s, the near-term goalposts for many capital intensive renewable companies moved further into the distance…. bankrupting most. But these cleantech 1.0 investments did ultimately help.
Since the peak of late 2000s and early 2010s, commodity prices have plummeted and (driven by those early investments) renewable prices have chased them down even faster.
This framework us one I use to evaluate an industry’s readiness for change:
Is a new technology viable due to temporarily high incumbent costsor is the new technology sufficiently developed to chase the incumbent solution WAY down the cost curve? (to use a sports analogy: are we competing on a level playing field, or is our opponent handicapped? Don’t celebrate too much if the conditions are non-standard to your benefit!)
What makes now an exciting time for renewables is that nobody is really talking about price competition with traditional fuels anymore. We are way down the price curve: fuel prices are low and renewables are OK competing at those levels. And if there is a discussion around price, it is usually between different types of renewables.
This will be a 4-part mini-series on utility scale O&M. There are 4 different types of O&M where standardization is occurring:
Utility Scale Solar: priced per MW
Utility Scale Wind: priced per turbine
Utility Scale Distribution: priced per pole, or per mile inspected
Still developing segments: battery O&M; utility-owned rooftop O&M
I am starting in O&M as these prices are the most standardized. After this 4-part series I will get into utility scale construction contracts for these assets. And will end with development costs, as the development stage still has very little consistency and is where the largest value arbitrage still exists for software providers.
Part 1: Utility Scale O&M – 🌞 SOLAR ☀️
The average utility scale solar site is massive. 1 MW solar capacity site takes up about 2-4 acres. A few years ago a 100MW solar site would have been award-winning. But now renewable energy developers are routinely developing mammoth solar sites between 400MW to 1 GW+ in size.
As a result of the the increase in scale, a utility scale solar farm will sprawl between 300 to 3,000 acres. The size of the projects require new technology solutions.
How did O&M inspections use to happen?
Techs would walk a site every year. They would inspect each panel with a thermal imaging ray gun and look under each panel to make sure a wire routing to the inverter wasn’t busted or eaten by a pesky animal. For a 100MW site, two techs would cover the asset twice annually. Not only is this incredibly inefficient, but the remote conditions actually make for unsafe work environments.
The above photo is captured from a drone that has a thermal camera attached. The thermal camera immediately informs a pilot and operator which panels are not operating correctly.
The FUTURE
A drone’s ability to cover massive amounts of land in relatively short time periods, all while allowing a pilot to be more secure has made the product a perfect fit for the renewable energy industry.
For sake of simplicity, I am going to use a 100MW solar site as an example. (About 300 acres in size) Most operators of renewable scale solar are looking for monthly inspections. And the price range for a fully-baked service is around $300 per MW per year. This breaks down into:
$300 per MW * $100MW site = $30,000 drone pilot & drone-related aerial analytics
While most large-scale operators are now building their own drone fleets, the cost above assumes an outsourced drone pilot. A drone pilot for that scale is about $500 per flight: so 12 flights is $6,000 for the year in drone pilot costs. Removing this $6,000 from the $30,000 per site opportunity yields approximately $24k in revenue available to the aerial analytics platform powering the solar inspection, or about $240 per MW/year.
In 2020, analysts expect over 12 GW of utility scale solar to be installed in the US. This growth equates to $3.6M in new aerial analytics software contracts becoming available as these new utility scale solar farms energize in 2020.
Given how comparable the unit of pricing is here, there has been incredible competitive pricing pressure in this figure over the past 2-3 years. Aerial analytics firms focused on O&M in renewables used to get $600+ per MW flown. For this reason, I suspect we will continue to see this O&M price drop down closer to $50-100 per MW annual pricing on the O&M side.
The upside, of course, is that even at this reduced pricing a 1 GW site still creates a $50-100k/year software opportunity.
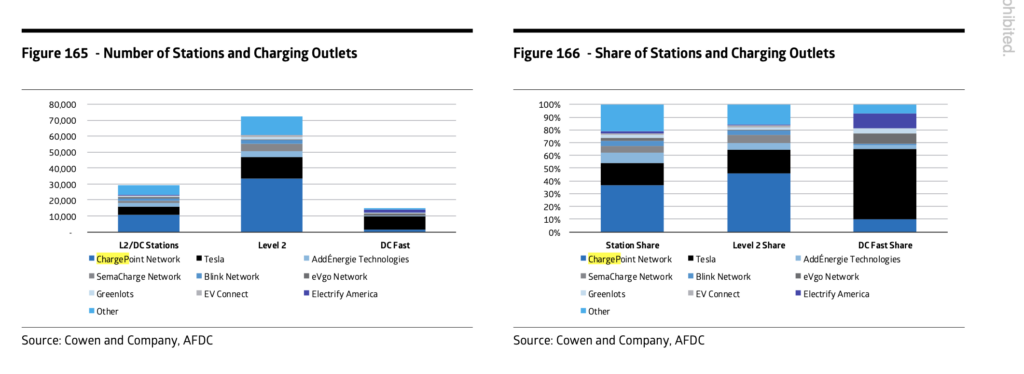
Why is ChargePoint a good SPAC target? Right now there are about 90,000 public chargers in North America and ChargePoint represents about 30-40% of that network. If you believe that mobility is moving from hydrocarbon fuels to electrons, then ChargePoint is a key lever in that transition. And should be a household name in the future.
Neither party has yet to release public financials, so I will not comment there. However, the SBE SPAC is a $300M vehicle and the average SPAC attains 10-20% of the target company through the capital investment. Using this framework, it appears that ChargePoint will aim to enter the market somewhere between a $1.5BN to $3BN valuation. The company has raised $700M to date and was valued around $1.2 billion in a financing round announced in Q1. So some of these valuation levels will provide for a nice return to early shareholders.
Some of the earliest investors on the cap table have been involved for over a decade. While the IRR may not be great, these investors saw the opportunity to be the largest EV charging network in the US. And that early conviction should be rewarded as ChargePoint has persevered through the years. I hope they succeed in the public markets.
We are near the final days of accepting resumes and I have personally reviewed each candidate that has applied. Before getting to the statistics, I want to say that we are absolutely floored by the quality of the candidates. In addition to the incredible brainpower and experience in the candidate base, I am proud to say that Energize’s efforts to expand our outreach resulted in a diverse set of candidates. With this level of quality professional showing interest in accelerating the energy and industrial transition, I have renewed confidence in our ability to make progress.
We received nearly 300 resumes for the Associate roles and over 100 applicants for the Principal position. In the coming days we will be narrowing down the pool of Associates and can’t wait to meet the new potential hires. Upon final review we will share more details, including the diversity metrics encouraged by Chicago Blend.
The purpose for this (and other upcoming) analysis is to highlight the traditional industrial technology firms that are re-accelerating growth through M&A. Hopefully this information is useful to start-ups that address the industrial technology market. Over the next few weeks, I will be highlighting the top 3 firms, beginning today with Rockwell Automation.
Rockwell Automation is a Wisconsin-based industrial automation and information firm with over 23,000 employees across the globe. The company has $6.5 billion in annual sales, 40% gross margins, and approximately $1.5BN in EBITDA. Those financials earn the firm a market cap of $26 billion dollars and enterprise value near $30 billion. This means Rockwell trades at 4-5x revenue, and 20x EBITDA. Here is their 2019 Investor Presentation.
As detailed below, my high ratings for Rockwell are due to their well-structured focus on infusing new technology’s into their business. Here are the 3 parameters:
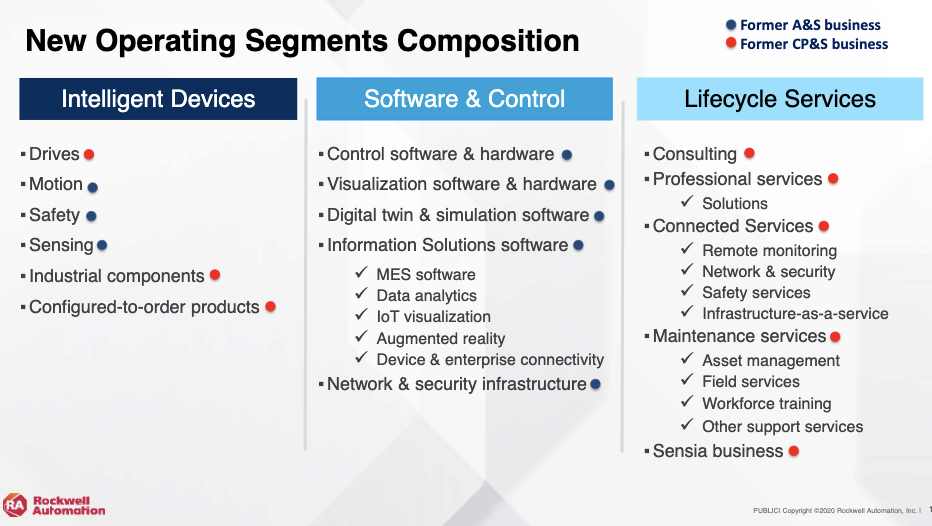
Rockwell used to have a maze of different business units. Now they have simplified their business into 3 segments: hardware (connected devices); software (software & control) and services (lifecycle services). As shown below, they now also clearly detail the products in terms of functionality, making it easier for customers and partners to identify the best internal champions.
Clear & Consistent M&A Goals, with Recent Examples
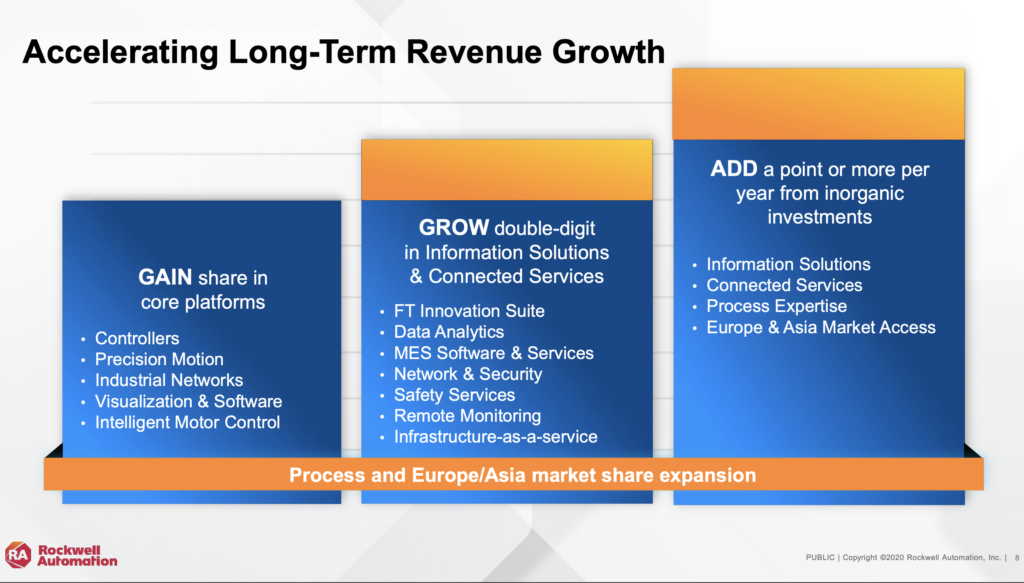
Unlike most firms, Rockwell actually specifically calls out that they intend to grow topline revenues through inorganic means. Inorganic = addition through M&A! And, they indicate both how much they want to add and in what groups. This feedback to the market is very rare.
This chart shows that Rockwell is looking to add 1% of growth per year from M&A. Since the company has $6.5 billion of revenue, this means that Rockwell is looking to add $65-100M in revenue from acquisitions each year. And combining this page with the earlier “segments” image, Rockwell makes it clear that they are targeting a company (companies!) with focus in:
Information Services: MES software, data analytics, IoT visualization, Augmented Reality, Device & Enterprise Security
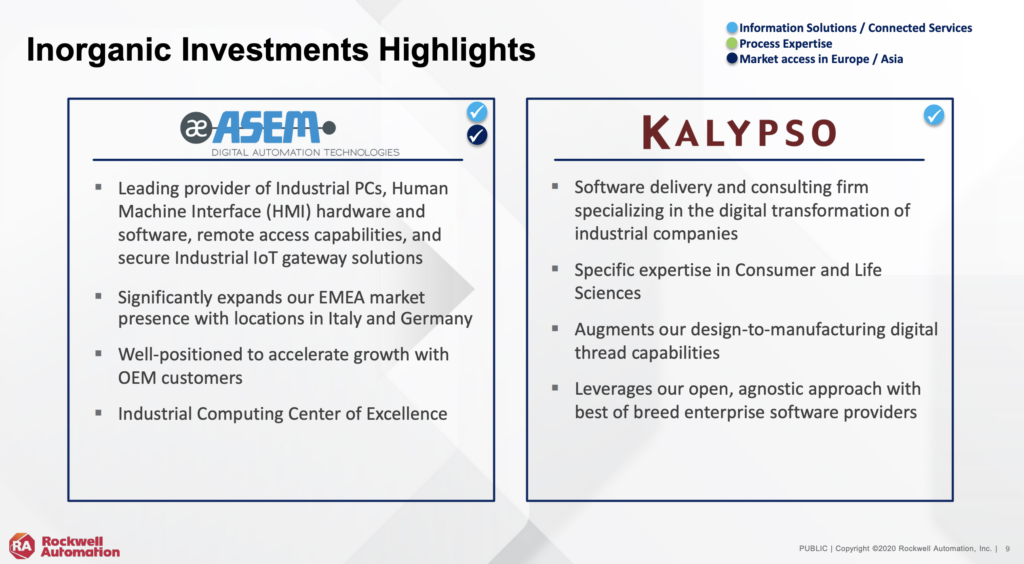
There is no hard & fast rule, but using their own guidance, it looks like Rockwell is acquiring software and systems controls businesses when they hit revenues at/near $50M levels. Kalypso is software and services focused and ASM is an industrial technology firm.
What about valuation? Industrial technology firms don’t like to pay high acquisition multiples. These slower-growth businesses tend to be valued off of EBITDA. As indicated earlier, Rockwell trades around 20x EBITDA. However, Rockwell is trying to change their narrative to a more growth story. And in either case, higher multiples can be done when an industrial technology behemoth believes that they can bolt-on the software business and immediately increase distribution at a relatively low marginal cost. I have seen a $30M software business with no EBITDA get purchased by an industrial technology firm do $100M the next year and $40M in EBITDA. When a firm like Rockwell sees this ability to leverage existing distribution with a new product, they will pay premiums. The recent OSI transaction also shows industrial technology companies are willing to pay 10x revenues. Given those frameworks, a $50M software revenue bolt-on could be valued at/near $200-600M+, depending on the availability of those synergies.
There is less detail available on channel partnerships and recent investment examples. On Pitchbook, there are 3 public venture / JV-related investments:
Claroty: OT / IoT cybersecurity platform. This looks to fit within Information Solutions: Device and Enterprise Security. Rockwell joined a $60M growth round.
Sensia JV: Provider of digital oilfield solutions from well to terminal. Rockwell paid $250M to own 53% and Schlumberger still owns 47%. This is an example of visualization software that fits within the Information Solutions vertical – and can be classified as inorganic growth.
Atom Power: Developer of digital and programmable circuit breakers designed to democratize commercial and industrial power distribution. This fits somewhere between Intelligent Devices and Software. Rockwell joined a minority, growth round.
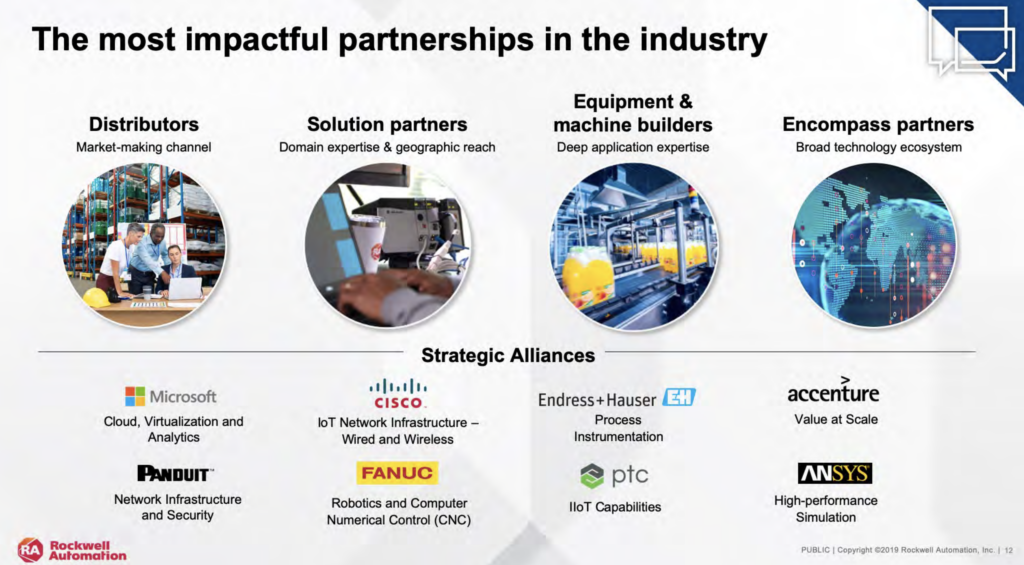
The company also has larger scale partnerships to help with distribution, solutions and equipment, as seen below:
In Summary
Very few firms provide such context on their intent and area of focus for inorganic growth. Rockwell makes it pretty clear: acquiring at least $250M of revenue derived mostly from industrial software businesses over the next 3-4 years. The business units are simplified and the areas of focus for growth are well-defined. I expect Rockwell to be an active player in industrial technology M&A over the coming years. High growth start-ups in the space should develop relationships accordingly…
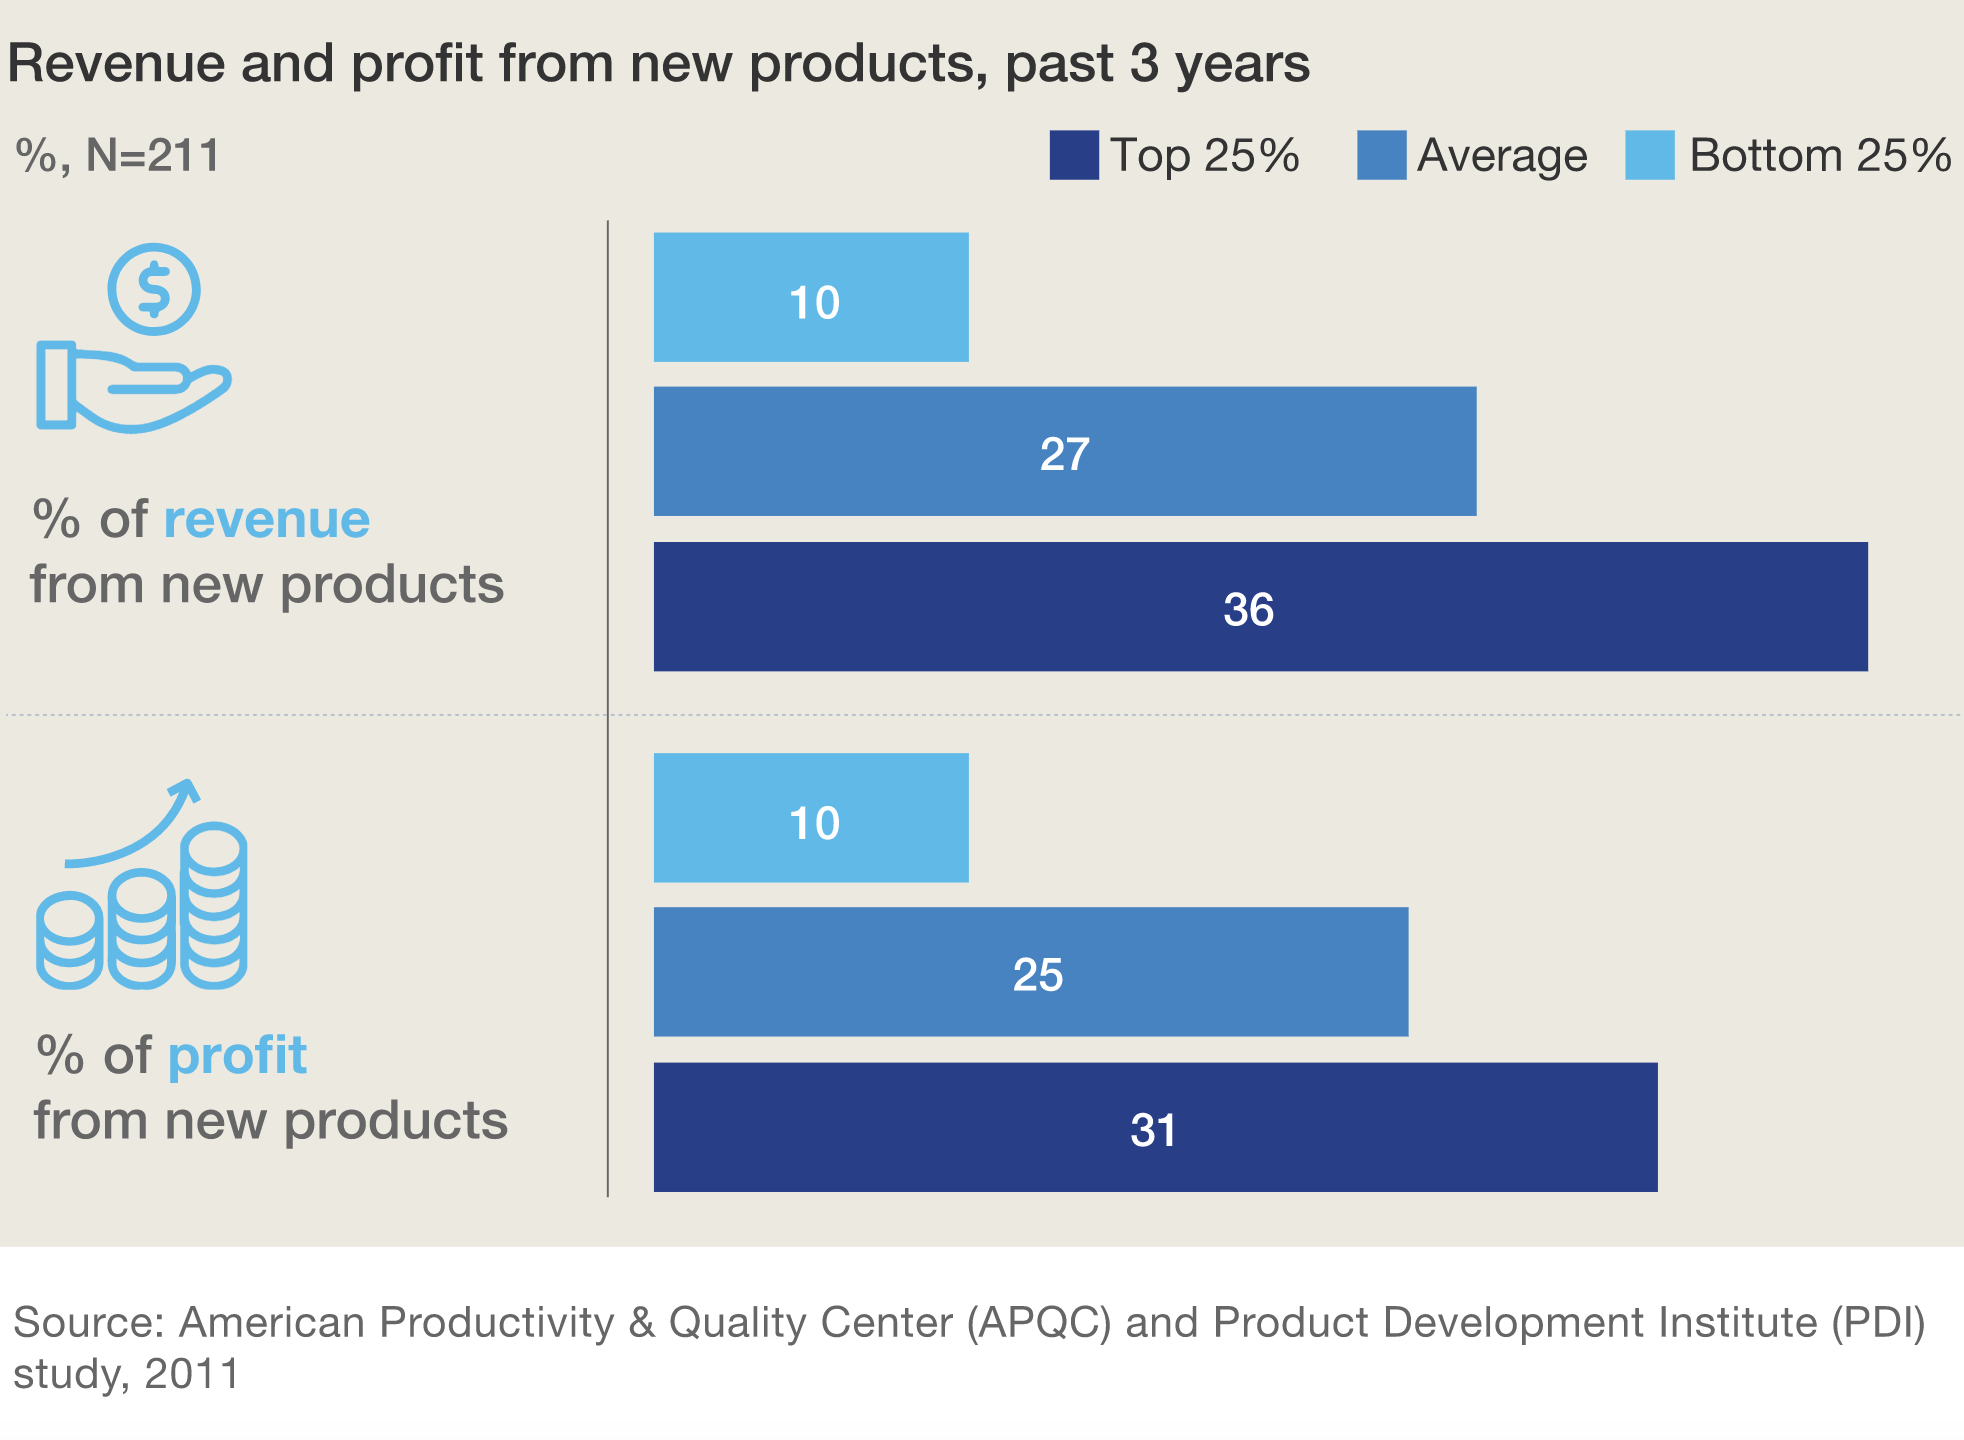
A company’s ability to innovate can be witnessed by studying the firm’s ability to develop and commercialize new products. Accordingly, select financial analysts look quantify innovation by identifying the new product revenue contribution to a company’s total revenue. “New products” is generally defined as products created and distributed for the first time in the past 3 years.
Using this quantitative framework, a company’s product innovation can be quantified as:
(Revenue from products created over past 3 years) / (Total Revenue)
According to McKinsey, the most innovative firms have a stunning 33% of their revenue from new products.
By definition, nearly all start-ups achieve 50-100% metrics within this calculation. The key is keeping this innovation of new products alive as a company matures. What is most impressive is when mammoth companies like Microsoft achieve >20% success by launching new cloud products that meet a customer need and can be sold through their existing distribution channels.
Many energy and industrial firms fall between 5-15% in this calculation. These lower levels are due to:
1- Asset turnover is when new product sales opportunities become available. But industrial products and energy generation tend to be in operation for decade(s). Changes in generation are accelerating now, though!
2- Hardware distribution is very different than software distribution. And we now know that software has a faster ability to iterate and create new products for customers. 90% of industrial sales tend to be hardware although the core industrial tech firms are looking to change that balance to more software-driven.
3- Systems interoperability requirements of the physical environment act as a breaking mechanism on accelerated product development
As a result, many energy and industrial firms are now looking to startups to infuse new product innovation and software distribution into their organizations. Tomorrow I will begin reviewing the top industrial partners that are looking to inject technology and software innovation into their future cycles.
Complexity Theory’s Approach to Climate Adaptation
One of my favorite books of 2020 is a classic, Complexity Theory. The book covers how ideas converge at the edge of chaos. And specifically how technologies come together in unique combinations at almost required points in time to drive forward industry.
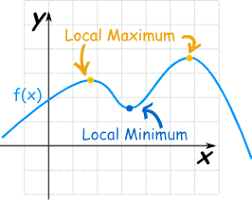
Near the end of the book there is a segment on climate change, that I believe is very relevant for our current market status. Right now there are ongoing debates between different fuel types and their pros/cons and various proponents are staking out their positions and getting entrenched. My favorite paragraphs from the book show how we should be approaching climate adaptation by embracing many different technologies. By enabling a suite of differing technologies, we retain optionality to optimize for the long term maxima, as opposed to being stuck in an intermediate peak.
“When you are part of the cycle, as in climate change, it is not a duality of us vs them. It is integration. Accommodation and coadaptation so you optimize for the right peaks and not a local maxima that could extinct you.”
“And so how to maneuver in a world like that: the answer is to keep as many options open as possible. You go for viability, something that’s workable, rather than what’s optimal. A lot of people then say: aren’t you accepting second best? No, you’re not, because optimization isn’t well-defined anymore. What you are trying to do is maximize robustness, or survivalists, in the face of an ill-defined future. And that, in turn, puts a premium on becoming aware of non-linear relationships and causal pathways as best we can. You observe the world very carefully and you don’t expect the circumstances to last.”
Today I am covering the next level of consumer energy products:
rooftop solar
community solar
As you will see below, the payouts for these two products are the highest in the energy market. Why? The payouts have to compensate the platforms for the high cost of capturing and educating customers on energy options, a topic that is considered by consumers for a whopping 6 minutes a year.
Therefore, many energy platforms are either:
1- widening the funnel by pairing with other home services related products: digital home products like security, connected devices, real estate brokers. The goal here is to have the energy product be a bolt-on purchase in the purchasing discussion.
2- looking to “pull up” customers from more entry level energy products, like retail energy, Nest thermostats, or HVAC relationships. The goal here is to capture the customer when an energy professional can quickly quantify the savings and resilience benefits of these energy products.
Rooftop solar
The costs for rooftop solar have declined dramatically over the past decade. However, most of those costs have come from the hardware and “Balance of Materials” (BoM). But customer education and acquisition costs have barely declined in the same period. While many firms are trying to go to digital engagements, most of the customer acquisition in this industry is hand-to-hand combat. This involves door knocking, out of home education and long sales closes.
These costs are sufficient to create a lucrative business for a digital platform to make real revenues.
Solar is installed on a size basis: the average rooftop installation in the US is around 6-7kW. And a 6 kW system is about $15,000 fully loaded cost to a customer, pre-tax. In the origination market, you can get paid for a qualified lead or for a fully delivered customer. (Fully delivered meaning you get paid upon installation.) Most of the market has moved from lead to installation.
They payout figures in market are around $200-300 per kW installed. This means that for the average US installation a platform that helps originate and qualify a residential solar customer will get paid between $1,200 to $1,500. At ChooseEnergy, there was a year where we were the largest online originator of rooftop customer solar customers. Since we had an extra exposure on Texas and the northeast, our average installation was 9 kW so we were clipping around $2,000+ per customer.
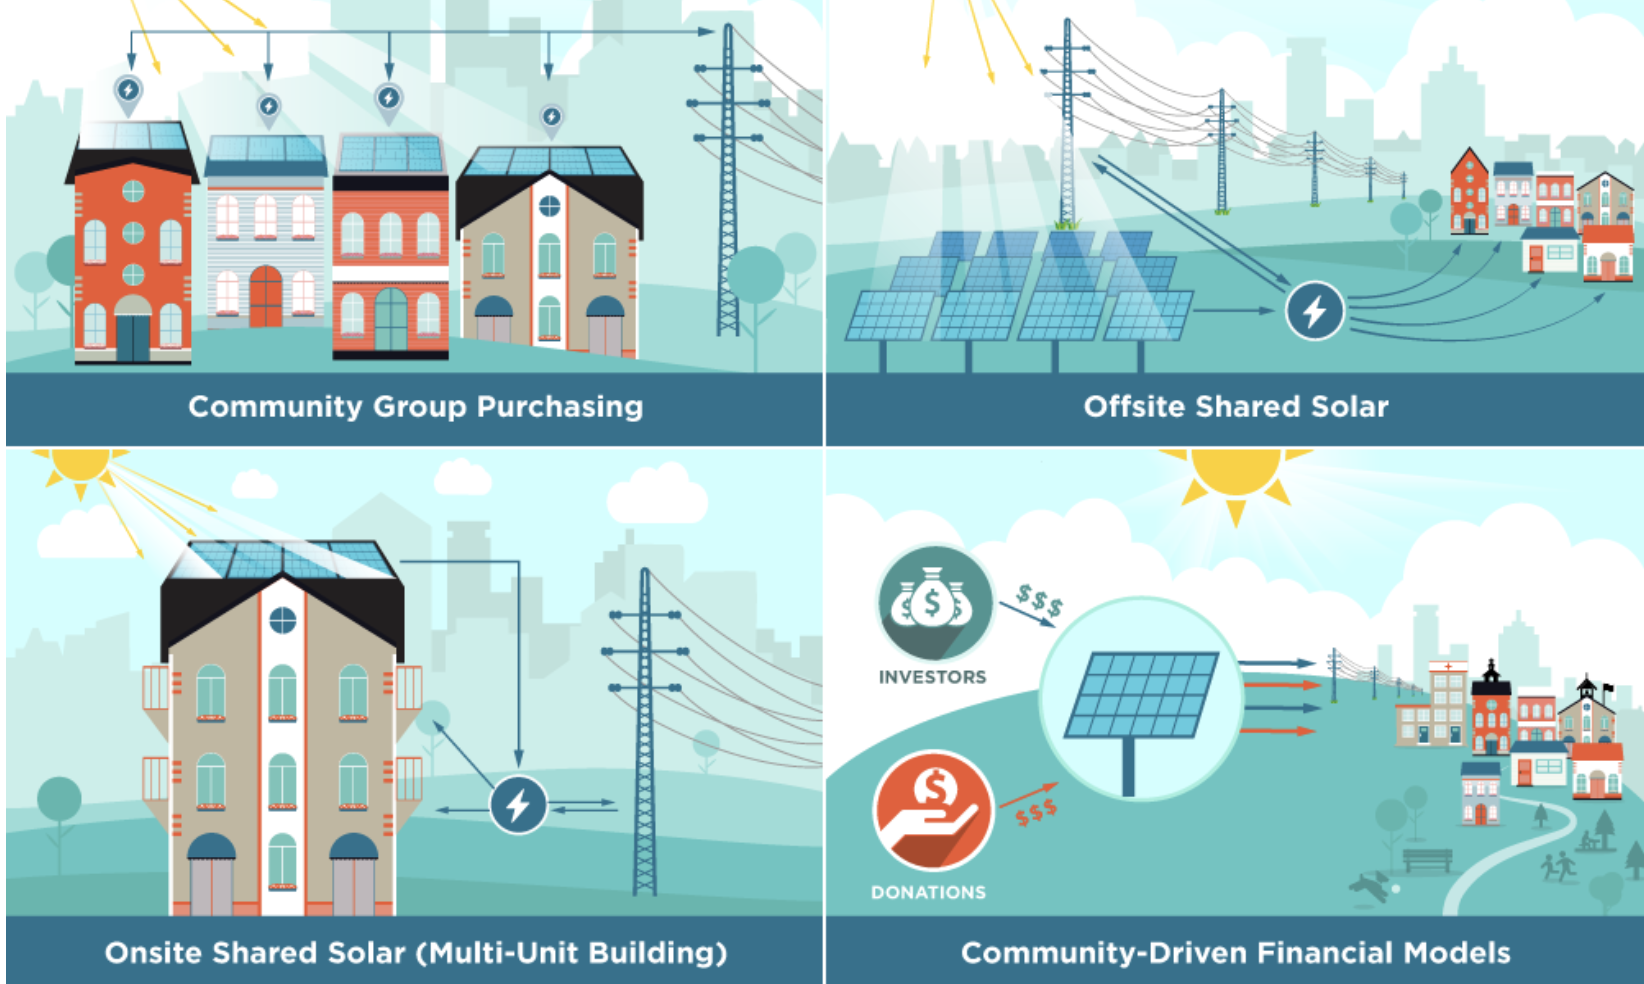
Community Solar
Community solar is when a customer buys a portion of a (usually) nearby solar farm. Large, utility-scale solar farms look for long-term Power Purchase Agreements (PPA) whereby the credit of the off-taker can be used to help finance the near-billion dollar projects. The off-taker in those utility-scale cases are Fortune 500 companies with big balance sheets.
Community solar is usually designed for smaller scale counter-parties: municipalities, smaller utilities, group buyers. Recent business model innovation now allows for traditional residential or commercial buyers to buy a share of these community solar sites. But the asset owners themselves still need longer-term, high credit commitments from their homeowner purchasers. One of the beauties of community solar, however, is that a homeowner who can’t purchase rooftop solar can purchase community solar. This opens up the market to apartment dwellers or homeowners with excess tree coverage /whose roof faces inopportune directions.
Due to the need for a 5+ year contract commitment and high credit consumer, the education and friction to acquire these consumers is high. This usually means that the community solar provider is willing to pay around $50 per year per kW of off-take meaning around $300 per year of contract signed, or around $1,500 per new customer if a 5-year, standard contract.
The companies in this space include
EnergySage: rooftop solar origination platform; exploring adding batteries
Arcadia Power: Green renewable energy credits to your utility bill w the goal to upsell to community solar products
The number of deeptech companies exploring SPACs is an indication that there is a gap in the market between post-venture financings and pre-scale commercial traction.
This gap poses a question if there can be a Long Term Stock Exchange-equivalent exclusively for more deeptech solutions. Why could this make sense?
Venture capital does a good job at funding early stage entrepreneurs that look to catalyze hard problems. In the deeptech space, however, the money and time between subsequent success milestones usually becomes increasingly capital intensive or lengthy. The technology developed in a lab or with early customers ultimately enters real-world production and integration.
Given how many deeptech investments directly interact with atoms (not just bits) the real world feedback loop requires more time and money. This extension is due to a combination of systems integration, hardware requirements and regulatory structures. Like biotechnology startups, when these deeptech businesses do ultimately achieve their benchmarks, the value and real-world impact is very material. And accordingly, the valuations are step-function increases.
I believe there are cohorts of investors (from young professionals to pension funds) that would be interested in financing these opportunities due to
1) the impact and world-changing potential of these company types and
2) the horizon exposure offered by financing these businesses. Young professionals and pensions like long-term investment horizons that compound over decades.
By my calculation that is around a $5-10BN per year financing opportunity – a figure measurably digestible within the larger equity markets. There probably needs to be a minimum hold period to ensure long-term alignment but everything else is up in the air. And given how these businesses are usually world-positive, perhaps these types of opportunities can also better match to a pre-tax contribution structure?
Who is working on this? Does anyone else feel similarly? With enough interest, I’d be happy to spearhead exploring this opportunity with an enterprising entrepreneur.
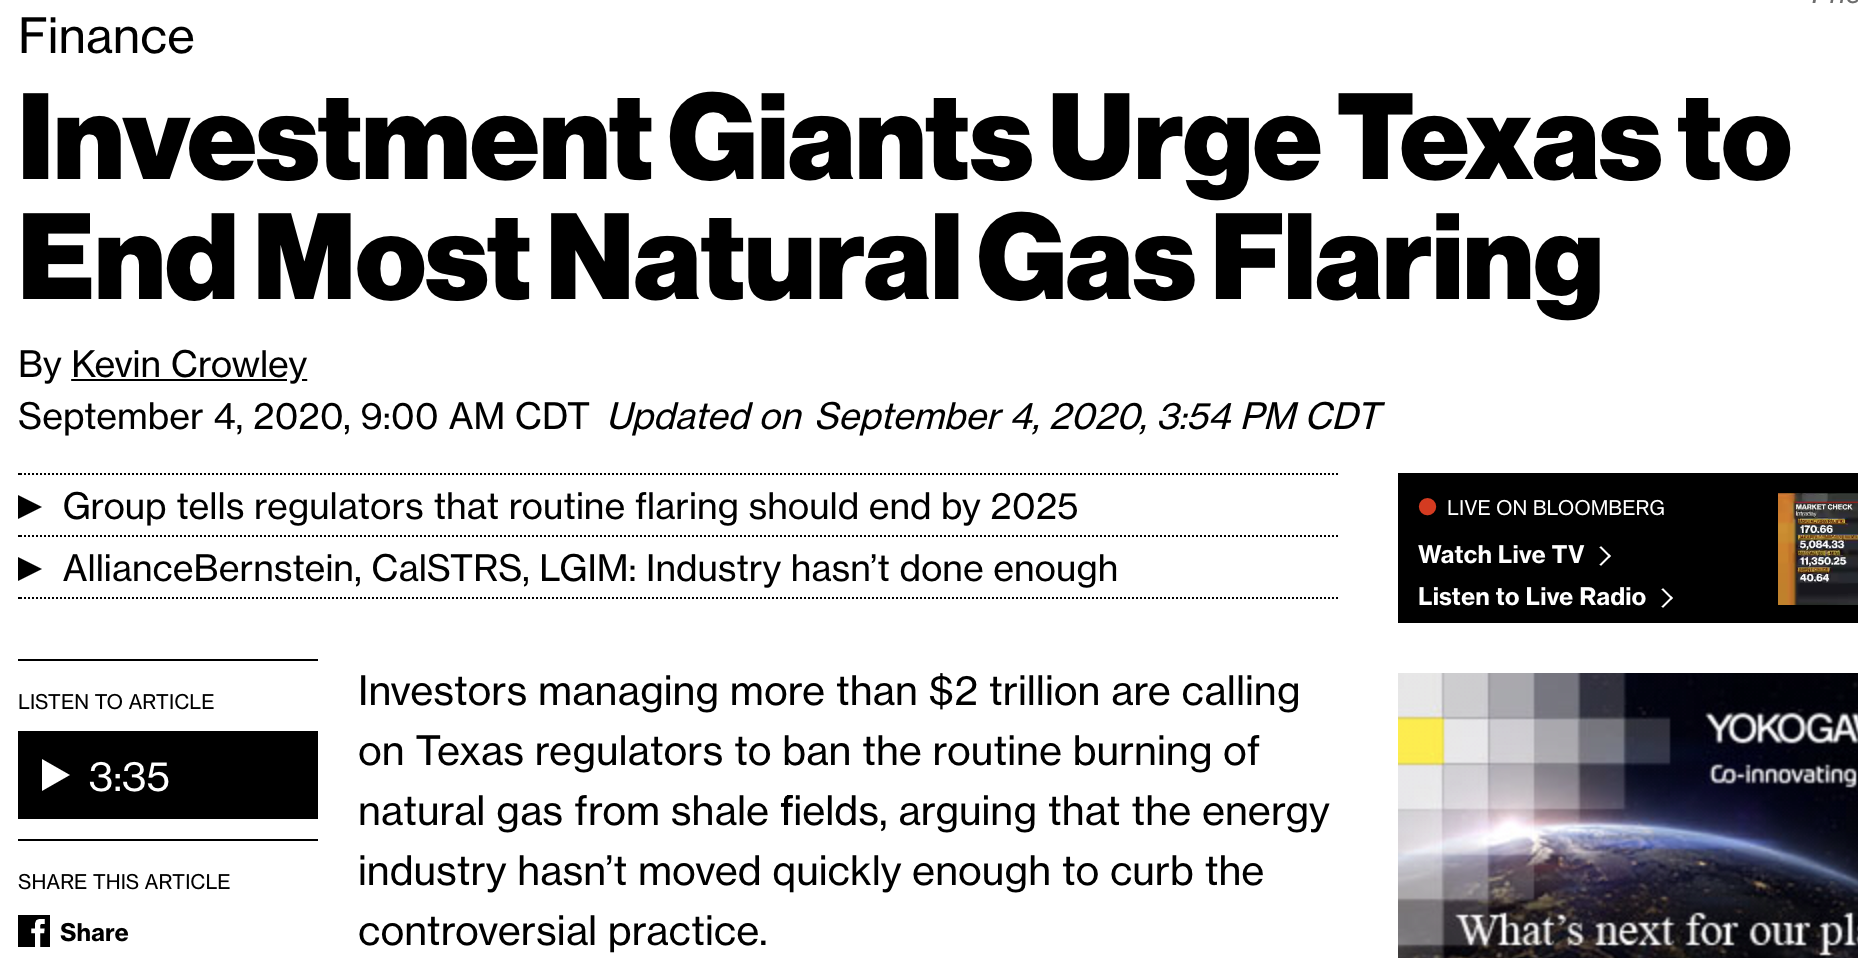
Capital allocation is a critical lifeline for the oil & gas industry. The industry is incredibly capital intensive: pipelines, refineries, rigs, fracking sites… are all multi-billion dollar efforts.
Given the capital intensity to build and maintain these carbon-emitting assets, when the money talks, the executives listen. And the money is beginning to talk:
Last year, Larry Fink at BlackRock wrote an impactful note to his fellow CEOs on climate change.
Climate Risk is Investment Risk:In the near future – and sooner than most anticipate – there will be a significant reallocation of capital.
The proclamation was bold, but not specifically targeting any asset or company. But now the allocators are calling out companies and climate negative firms.
That is a big change in communications and I expect we will see this level of climate-related activism grow. And the firms will listen.