If a start-up is targeting the energy and industrial verticals, they better be prepared for the 9+ month sales cycle. And when the start-up finally wins the account with a core product, the celebration needs to be brief.
While these customers do tend to have high retention, all of that upfront work earns the entrepreneurs something even more important: the access to expand.
In these asset-heavy markets, the two most natural ways to expand account size are:
Spread across the asset base (and price per asset)
Spread across the employee base (and price per seat)
Major growth can happen simply by executing on these two growth strategies.
But to move to top decile account expansion and retention, the best technology companies that serve the energy and industrial markets actively seek growth from new product development. And SURPRISE: these verticals are VERY receptive to product-driven growth. Why? Going back to an earlier post: trust and relationship alignment is the gold currency in critical infrastructure. If the installer, utility or asset owner trusts the start-up with a portion of their software, the customer is going to default to working with the existing relationship to solve new problems in the organization. The vendor vetting processes are hard and budget expansion within a Purchase Order is easier than a new purchase order! But most of all, trust is established.
When product-led growth occurs, software gradually takes over digitally underserved areas within a customer. This intra-company expansion quickly dissolves the boundaries on any prior, well-defined Total Addressable Market Analysis.
Every businesses in the Energize portfolio is executing on a combination of these three growth techniques: asset expansion, seats expansion and product expansion. Product-led growth tends to be the most stepwise in commercial advancements.
In a post tomorrow I will write about what techniques I have seen start-ups implement to accelerate product-led expansion in the energy and industrial verticals.
Ty Findley covering Industrial Tech on The Full Ratchet
I am a big fan of Ty Findley and the work he is doing as a Managing Partner of IRONSPRING. Ty was recently on an episode of Full Ratchet with Nick Moran. On the episode Ty referenced some of the work on industrial technology exits… and gave me one of my better nicknames “Digital Industrial Partner in Crime!” The content in this episode is excellent.
And the link to the M&A statistics that Ty and I put together can be found here.
I encourage you all to listen to the podcast. In the content you will hear Ty’s wisdom in knowing the nuances of the industrial market. He also reveals his passion for entrepreneurs to make the correct decisions around capital efficiency and go-to-market strategies.
There were two specific segments I really enjoyed and highlighted those below:
“…sympathetic as to why it is so challenging to sell technology into these industrial markets… there is a lot at stake in the OEM production environment. I try to put myself in the customer’s position when evaluating how they will purchase the technology. Everyone jokes about buy SAP before you buy a start-up to keep your job.. but think of it this way: if (an incorrect deployment) of new technology inhibits a 737 production line, it is less about that one airplane… but you are actually stopping GDP that was supposed to fly because of that slip-up. Need an appreciation for the complexity “
“If a founder from the beginning takes the right capitalization strategy and is capital efficient in tackling these industrial markets… the markets are huge… and massive opportunities to drive value to customers and Limited Partners”
And finally, this phrase shows just how important it is to keep investing in these hard-tech businesses:
“Can’t afford to leave these industries behind in tech, they matter too much“
Go listen!
Begin with the end in mind. Don’t get caught up in the hype of traditional Silicon Valley.
The purpose for this series is to highlight the traditional industrial technology firms that are re-accelerating growth through M&A. I will be covering 3 firms, and there may be an encore. Earlier this month I covered the first of the firms, Rockwell Automation. This week I am covering… Honeywell.
Honeywell is a Charlotte, North Carolina based industrial conglomerate with over 113,000 employees across the globe. The company has $37 billion in annual sales, 33%% gross margins, and approximately $8-9BN in EBITDA. Those financials earn the firm a market cap of $113 billion dollars and enterprise value near $120 billion. This means Honeywell trades at 3x revenue, and 14x EBITDA. Here is their 2019 Investor Presentation.
I really enjoyed researching Honeywell for this process. Honeywell is on a journey to become a software industrial. Quarterly reports, annual reports, press releases, hires and new product lines all point to an incredible investment underway to help Honeywell change their business model. Switching a primarily hardware firm to embrace a software product and distribution model is a herculean task. But, everyone remembers Hercules… so it only takes one. Here is why I think Honeywell can pull this off: the standing up of an independent Honeywell Connected Enterprise (“HCE”), and the launch of the core product Honeywell Forge, the Enterprise Performance Management suite. Given how intentional Honeywell management is in noting that their growth and M&A will come from within HCE, I will be focusing my M&A / inorganic growth review therein.
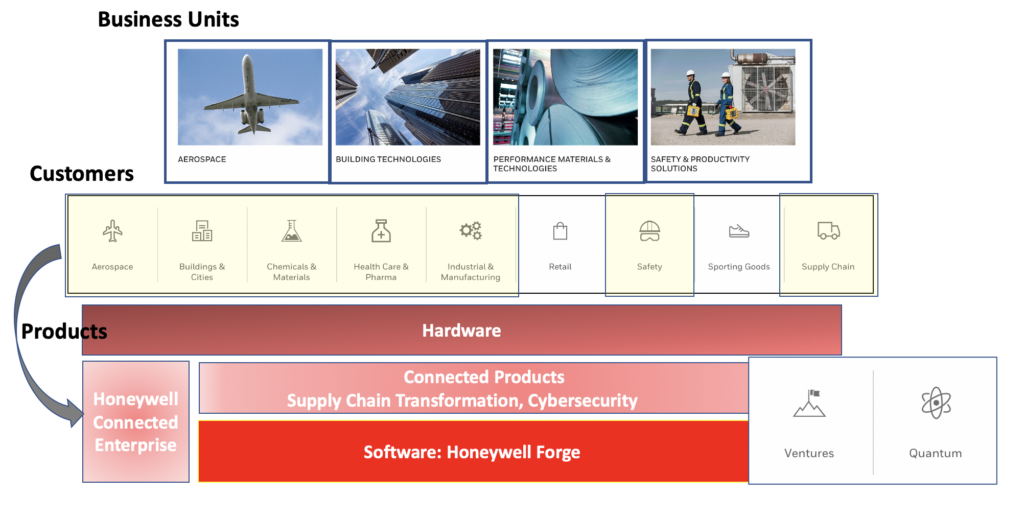
This one image is the best way I can capture the current state of the organization:
Honeywell Corporate Structure Focusing on Digital Innovation
Aligned and Simplified Business Units: 4/5
Clear M&A Goals, with Recent Examples: 4/5
Clear Minority Investment Goals, with Recent Examples: 5/5
Aligned & Simplified Business Units
Honeywell has 4 business units with a diverse set of customer types that fit within the groups. The four divisions are:
Aerospace
Building technologies
Performance Materials & Technologies
Safety & Productivity Solutions
The firm also has a cross-functional division, Honeywell Connected Enterprise, that delivers digital products and services across the entire organization.
As seen in the first graphic, the Honeywell Connected Enterprise is comprised of HW/SW products, and exclusively software products. At the core of HCE and the software effort is Honeywell Forge. Many industrial firms look to create a central platform to aggregate technology solutions. Honeywell is taking a different approach with Forge: it is a domain-specific, low-code cloud operating model built to be system and OEM agnostic. The cloud suite simplifies data extraction from assets, people and process and uses a combination of proprietary AI/ML mechanisms and partner applications to solve business-specific problems. In the past, industrial firms have tried to take a “one platform fits all” approach. HCE, however, is accepting domain-specificity and the power of the Subject Matter Expert. And accordingly is delivering a model and supporting applications tailored to the business outcome.
While this focus on creating low-code, cloud, and domain specific industrial models may seem obvious, the fact is that each of those items (low code, cloud, AI/ML) are all “why now” events that simply couldn’t be been combined in an economic fashion even a few years ago. And this conviction, it appears, is where a lot of M&A growth will be focused.
Clear & Consistent M&A Goals, with Recent Examples
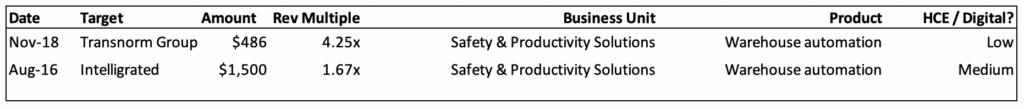
Over the past decade, Honeywell has acquired 25+ companies. Most of these acquisitions are small bolt-ons or have little publicly information. However, over the past 4 years the acquisitions began to grow in scale and towards the software narrative. My personal favorite of the recent acquisitions is Intelligrated. Honeywell acquired Intelligrated for $1.5 billion and gained supply chain automation solutions that include cloud-connected mobile worker applications, high-performance data collection hardware, and other technologies to improve worker productivity. With the growth of e-commerce, warehouse and logistics software is a clear growth market.
Here are the recent notable M&A events at Honeywell.
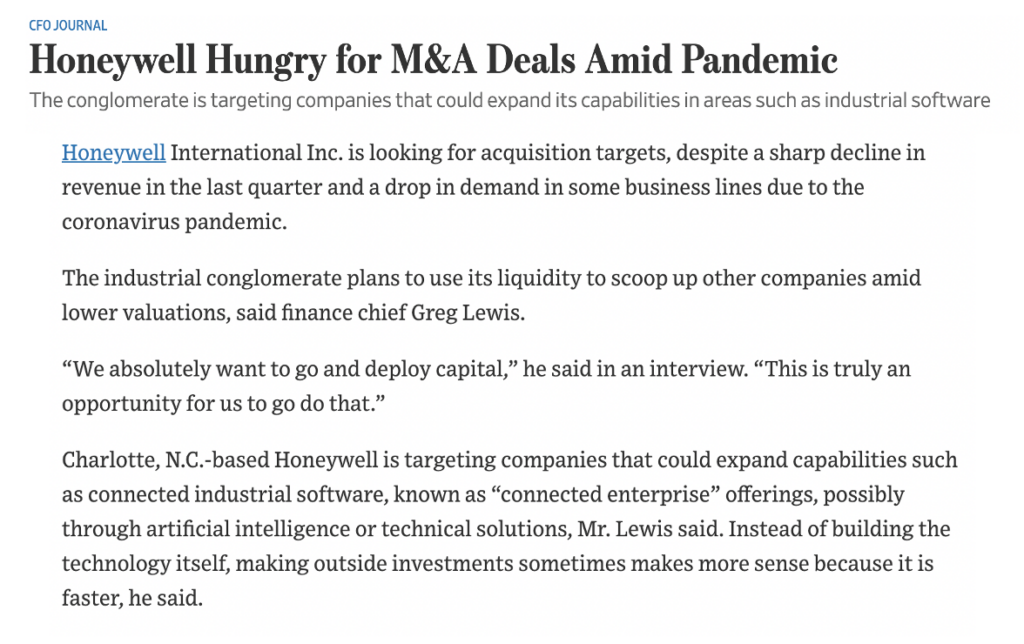
Interestingly, though, it appears that the future M&A strategy is different than the past. Here is a clip, with quotes from the CFO, Greg Lewis, from 3 months ago!
Credit: WSJ
Later on in the article, the CFO highlights nearly $1 billion in cost savings and $3 billion in new financing structures to bolster Honeywell’s cash balance to $15 billion. Combine that cash balance with a recently hired world-class Head of M&A, Emily McNeal, and Honeywell is going to be hunting.
So where will they be hunting?
Supporting Data 1: In the past 12 months, Honeywell has built out a M&A team specific to HCE. And you can bet their Key Performance Indicators are to acquire technology & revenue… at fair multiples.
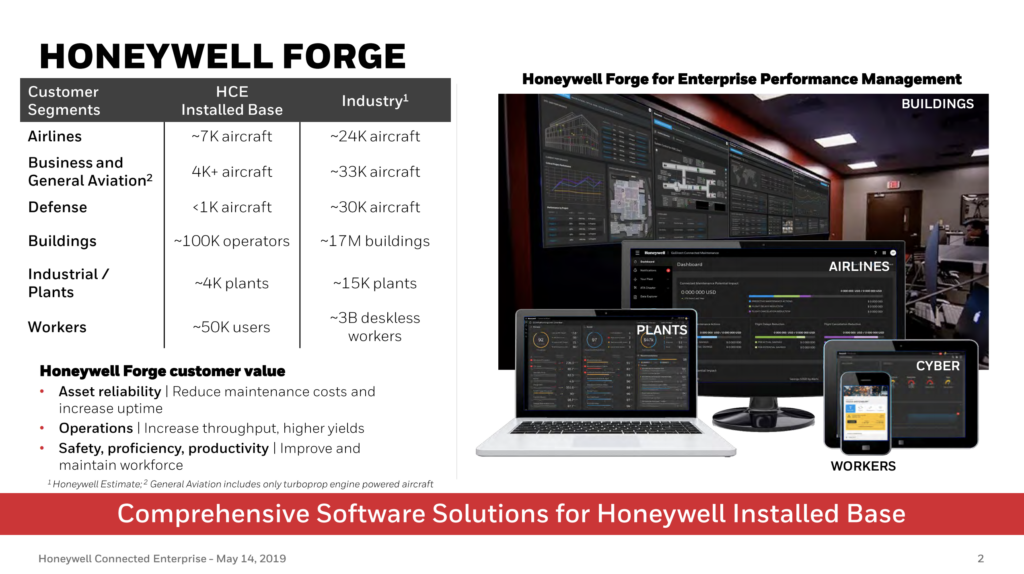
Supporting Data 2: Per the “Why Now for Forge” from above, these two pages (seen below) are starting to show up in nearly every shareholder presentation:
Come hell or high water, Honeywell is going to invest into digital solutions to enable HCE and Forge. Honeywell HCE execs are starting to see that their sales execs can sell software into existing customers. And Honeywell needs those early wins to gain confidence to make M&A moves. Based on these pages above, it looks like they are particularly focused on horizontal software applications that address a combination of the below industries:
Honeywell has built up a sophisticated Ventures effort. This effort is led by Murray Grainger. As the screenshot below shows, Honeywell has made it crystal clear in what technologies they want to make minority investments. This clarity is very helpful for the market. And if you want to see if
While the company does not specifically say ‘software’, 12 of their 13 listed investments are software-dependent investments. And these software platforms are primarily horizon applications and serve a number of the asset-heavy industries through the core program. As shown in the initial diagram, Honeywell also has a quantum computing effort and a few of their minority investments have exposure to those opportunities. There is also a similar exposure to Industrial Internet of Things communications networks, and managing the complexity of those sites.
AirMap: Digital airspace and automation company serving the drone economy.
Zapata Computing: Developer of quantum algorithms designed to commercialize quantum computing technologies.
Foghorn: Developer of an edge intelligence software designed to deliver the power of real-time industrial-grade analytics to resource-constrained edge devices.
Theatro: Developer of a wearable communication device designed to revolutionize in-store communication and hourly worker productivity.
These types of deals over the past 24 months are more consistent with the future M&A goals that enable Forge. A majority of these companies are digital first with cross-industry customers.
In Summary
Honeywell is biased towards action and growth around their software strategy. They have set-up Honeywell Connected Enterprise to enable the digitization of the connected products and quickly ramp up their software offering via existing sales channels. Honeywell is not trying to hide their ambitions: the goal is to build low code, cloud-enabled and domain-specific industrial operating models that embeds proprietary and third party applications.
With HCE and Forge as a software pillar, Honeywell is looking to grow their existing $1.5 billion software & connected products business by 20% a year. This growth means that HCE is looking to add $300M a year in digital revenues. While I suspect there are substantial organic tailwinds from existing clients seeking a digital relationship, I bet that Honeywell will seek to add similar amounts ($200M+) to topline digital revenues via M&A. any start-ups should be keen to get involved in the HCE and Forge application network.
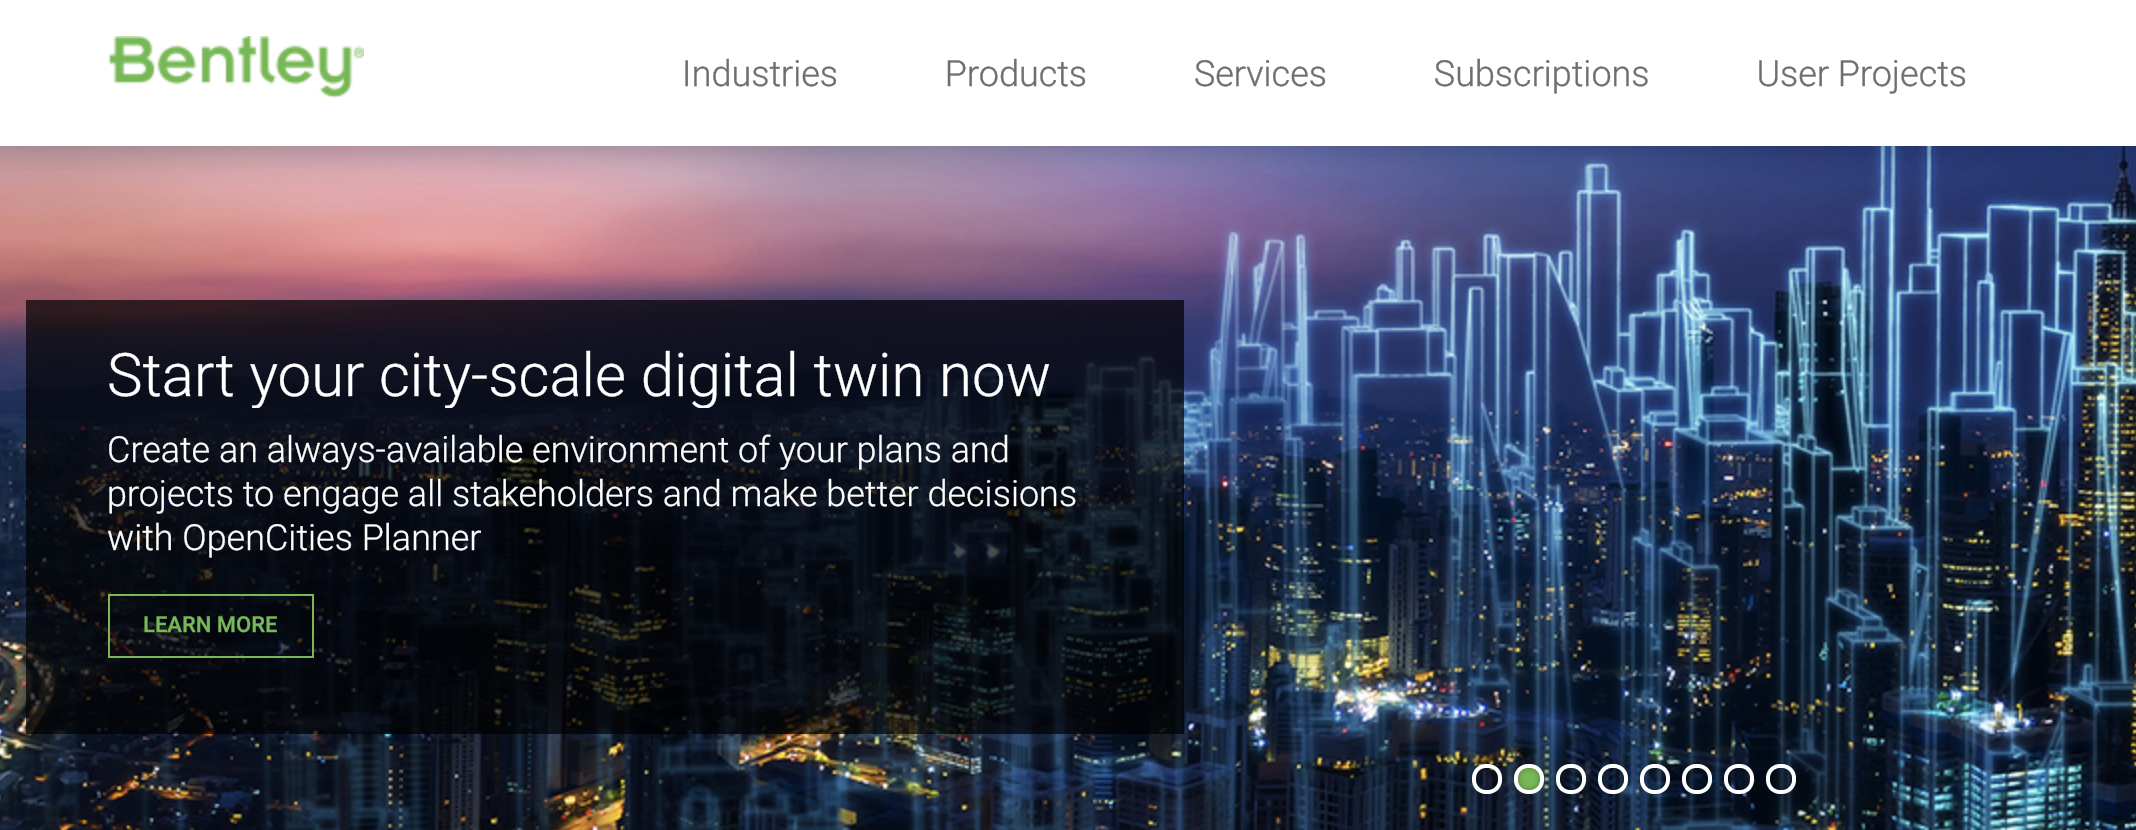
Amidst the dozens of SPACs and high flying technology deals, an under the radar industrial software company went public last week and very few noticed. The company is Bentley Systems, is headquartered in Exton, Pennsylvania and as over 4,000 employees worldwide.
Bentley is a leading provider of software for infrastructure engineering, enabling the work of civil, structural, geotechnical, and plant practitioners, their project delivery enterprises and owner-operators. The company counts over 34,000 customers across 170 countries.
Why is this an industrial technology company? Bentley Systems’ software products provide project lifecycle, asset lifecycle and digital twin solutions, servicing the public works and utilities, industrial and commercial/facilities industries.
Like OSIsoft’s long path to the billion dollar exit, Bentley was founded in the 1980s and has had a slow & steady march ever since.
Company History
Bentley Systems was co-founded by the Bentley brothers in the early 1980s. Since then the company has acquired around 40 different industrial software solutions. At the core of the core are three products:
MicroStation: CAD software platform for design & drafting
ProjectWise: engineering project collaboration platform for AEC industries
AssetWise: asset lifecycle tracking for AEC, buildings
In the early 2000s, the company tried to go public, but scrapped the idea and instead took a minority investment from Siemens that totaled $76M.
IPO Process Part 2
Over the past two decades the company has continued to scale and now has a very sizable software business. Over the 12 months ending June 30th 2020, Bentley Systems generated $770M of revenue and earned a gross margin of just over 80%. The company grew about 11% year over year, and so the growth is lagging other, earlier stage industrial technology companies. BUT the company actually has operating cash flow with $174M of operating income, or 22%.
Based on margins and the sticky customer segments, Bentley had a very successful IPO and raised $237 million US at a $5.75 billion valuation. Unlike other IPOs these days, all proceeds were secondary, meaning no incremental cash went onto the company’s balance sheet. Instead, early and long-standing employees were able to monetize a portion of their equity position. In fact, Greg Bentley, founder of the firm, is still Chairman of the company.
My usual analysis here talks about the time from a Series A or multiple appreciation from the last round. However, the company had no traditional venture financing. And so, like OSIsoft, this sector shows that slow & steady can bring a great, public business. The company now trades at 7.5x TTM revenues. Not too shabby, and well-deserved.
The industrial technology M&A tracker that I co-developed with Ty Findley is now updated with this transaction. Link found here
In Matt Ridley’s book, he talks about how larger infrastructure projects have a higher likelihood to get bogged down with excess costs. The costs begin in permitting and ultimately show up in another, comparative form: Smaller form assets allow for greater iteration during development and more adjustments while in operation- continuously lowering costs. This tweaking is innovation at its’ finest.
Both wind energy and solar energy have declined down the cost curve dramatically over the past decade. And they have gone about that cost decline in different ways.
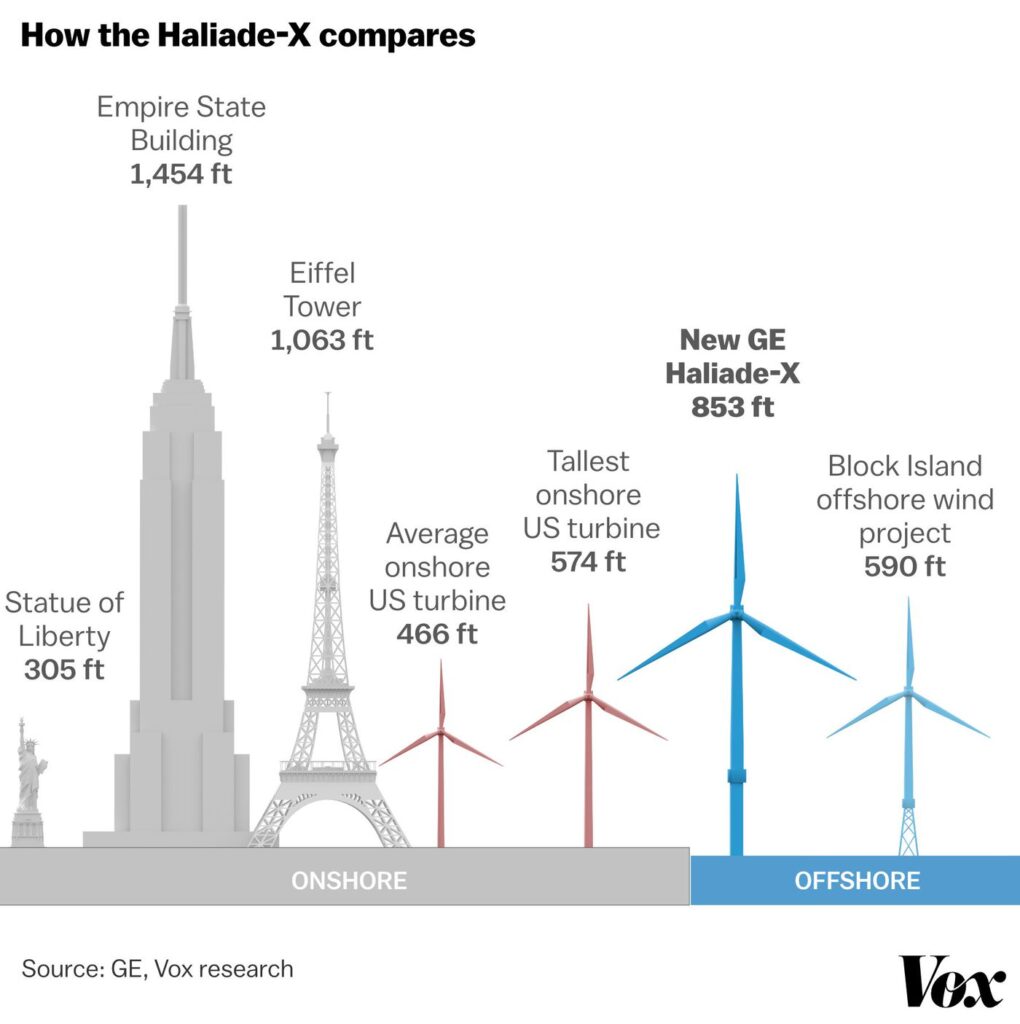
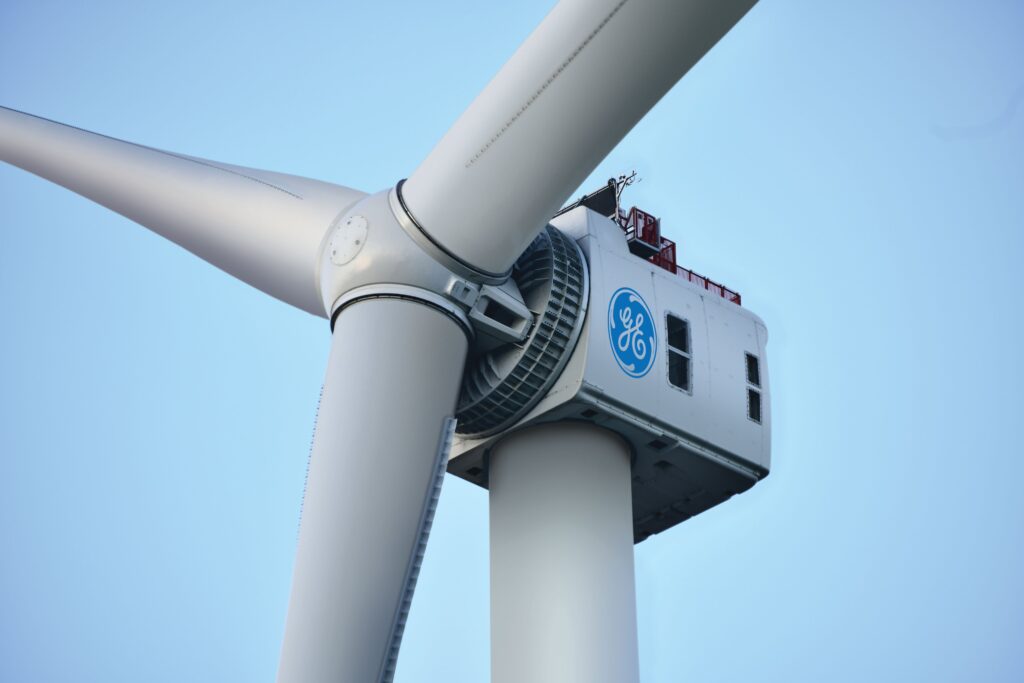
Wind blades are bigger. Blades and a turbine unit are ENORMOUS. Check out the graphic below. It is easy to forget now, but there was a time when energy professionals thought that small-scale, rooftop or backyard turbines could also be a viable solution. Wind has achieved cost declines by scaling a turbine and new materials and systems innovations. The latest GE Haliade-X is the size of a skyscraper and can power thousands of homes.
And solar (images after the wind turbines) has achieved scale by focusing on improvements to the panel (bifacial) tracker (sun-tracking, pneumatic) and systems (inverter technology) to make very rapid iterations in an array’s output. In solar, the unit remains small and the scale has grown in farm footprint, with sites now spanning 1,000s of acres.
Both energy forms will have a place in our energy transition. It’s fascinating how the two technologies are advancing and a reminder how hard it is to predict what happens next.
A few weeks back I indicated how I hoped that ChargePoint would have a successful market debut. Well, here we are! ChargePoint is about to hit the public market with their Switchback Energy reverse merger. The company released some basic information and is aiming to go public at a $2.4 billion valuation and is raising just over $600M in the process.
I like to keep my “highs” medium, and my “lows” medium and manage the emotional highs and low of being in the entrepreneurship game.
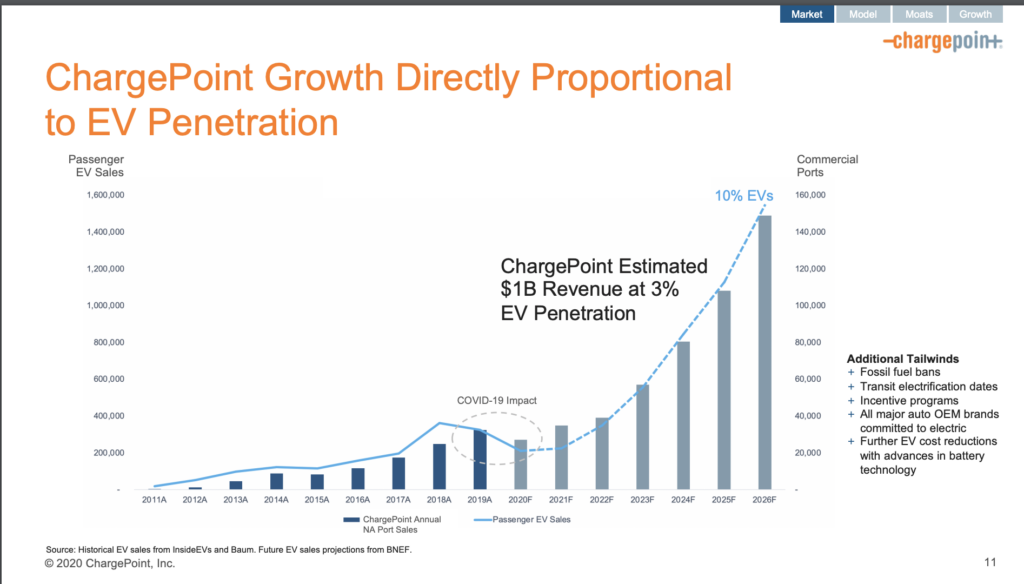
But, let me tell you… this is AWESOME for ChargePoint. The electric vehicle market is clearly the future. California is shutting down non-EV sales in a decade. The UK is doing the same. Other states will follow. EVs are the future and ChargePoint is the largest network. It should be a key part of the energy and mobility transition. And so, this access to the public markets is excellent for a number of reasons. Let me explain:
ALIGNED TO AN UNQUESTIONABLE GROWTH TREND
This picture below shows everything re: top-line revenue
CASH IS KING
ChargePoint will have approximately $683 million in cash, resulting in a total pro forma equity value of approximately $3.0 billion. Cash proceeds raised in the transaction will be used to repay debt, fund operations, support growth and for general corporate purposes. The proceeds will be funded through a combination of Switchback’s approximately $317 million cash in trust, assuming no redemptions by Switchback stockholders, and a $225 million PIPE of common stock valued at $10.00 per share.
And most importantly the company will now have an incredible amount of cash to continue building out their EV network. The demand exists as the number of Electric Vehicle sales continues to grow.
MATURING INVESTOR BASE
The energy transition has been mostly funded by venture capital and the corporate venture capital markets. To see key institutional investors including Baillie Gifford and funds managed by Neuberger Berman Alternatives Advisors joining the ChargePoint financing is VERY important for our market. These are long-term shareholders that are expected to be on the cap table for the build-out duration.
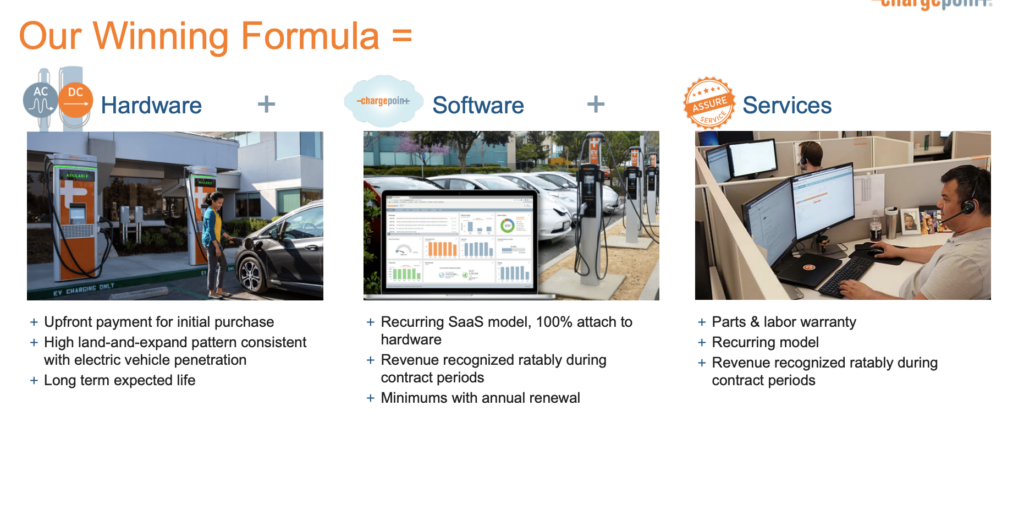
PRODUCT SUITE WILL EXPAND
With the infrastructure layer being built out, the application layer and software layer will become increasingly important. In the ChargePoint announcements, the company emphasized building out of software solutions, network management solutions and payment solutions. This software layer, including Vehicle 2 Grid and grid management techniques, will be very exciting. And main area where venture capital will fund voraciously.
FINANCING METRICS
Ultimately these are going to be a bit hard to swallow. This was 12 years from the Series A and at one point the company had raised ~$700M in equity to achieve a ~$1BN valuation. Not a lot of value appreciation. This is what “being early is like being wrong” may look like for an investor base. But the company, like the EV adoption market, has made great progress over the past 18 months and consumer demand has pulled ChargePoint towards greater scale. Big kudos to Michael Hughes, a relatively new Chief Revenue Officer there, for getting a lot accomplished.
VALUATIONS
ChargePoint will have around $135M of revenue in 2020, growing to 200M next year. And is targeting to grow to $2 billion of revenue by 2026. This high growth revenue opportunity is the growth the public markets are looking for right now in a low interest rate environment.
This means that ChargePoint’s current $2.4 billion enterprise valuation is 17x current year’s revenue, 12x 2021E revenue and ~1x 2026 estimated revenues. Yes yes, these are frothy. But in a low interest rate environment, the market is searching for 10-year growth opportunities and ChargePoint presents that unquestionable opportunity.
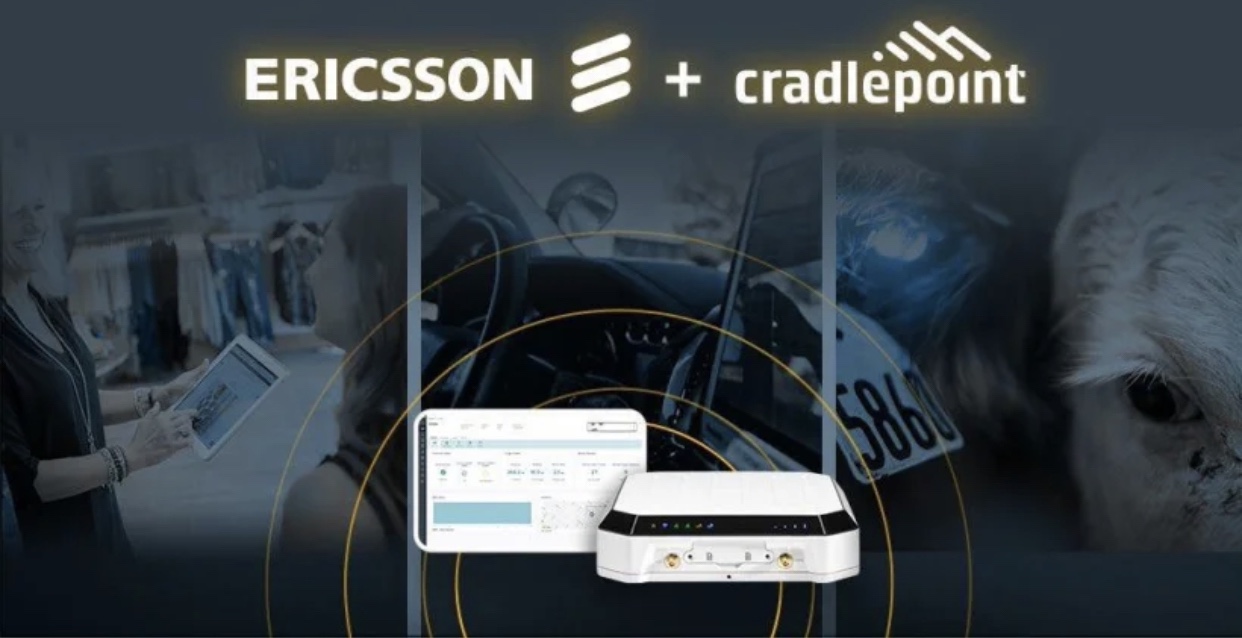
Last week there was another $1 billion + Industrial Technology deal. To most people, it won’t look too much like an “Industrial Tech” exit, but it sure is. To the naked eye, the company will look like tradition telecom equipment. Heck, even the buyer is Ericsson, one of the largest telecom firms in the world. But the fact is that the telecom industry will be one of the most active players in the IoT / industrial technology landscape. Every digital factory or distributed asset is now 5G or wirelessly connected: factories, EV chargers, automobiles, solar arrays, municipal fleets.. industrial assets are connected and the telecom firms are the information highway to our digital industrial world.
The company for today’s exit evaluation is CradlePoint, and they have a combination of routers and endpoint adapters that help corporations harness “LTE and 5G to wirelessly connect fixed and temporary sites, vehicles, field forces, and IoT devices, anywhere.” I first came across CradlePoint when our portfolio company, Volta Charging, was evaluating how to manage 5G connectivity for their chargers. Distributed assets like EV chargers now run a suite of software applications and need access to wireless solutions. Everything is now a computer. And computers need network connection to communicate and update.
As seen on CradlePoint’s site, their hardware/software solutions are used in a number of industrial verticals, including: transportation, digital signage, smart cities/buildings, industrial sites, and retail.
The History
The company was founded in 2006 by Pat Sewall and is headquartered in Boise, Idaho. The first well-documented investment round was the 2010 Series B, where a $11.5M investment at a $51M pre-valuation bought OVP Venture Partners and Highway 12 Partners 18% of the company.
In 2011, George Mulhern became CEO and has held the title ever since.
Over the years the company raised an additional $150M, including an $89M round from TCV in Q4 2016. That investment earned TCV ~25% of the business, meaning that the last notable private market valuation for CradlePoint was a $356M valuation. At the time industry reports show CradlePoint’s revenue around $100M.
The Exit
Last week that Ericsson announced that they are going to pay $1.1 billion for CradlePoint. And in the release the financials were revealed: “Cradlepoint’s revenues: $150 million in 2019 and are expected to grow to $200 million.” This means that Ericsson is paying approximately 6x current revenues for CradlePoint’s business. This is a premium for a primarily HW business. My expectation is that Ericsson sees extra value in being the network provider for the high growth, increasingly digital and distributed asset layer.
All early shareholders and investors are likely to be quite pleased here, including TCV who likely earns >30% IRR and turns $89M into ~$260M within 4 years. The Series B investors likely converted their $11.5M investment into ~$200M at exit.
On timing: CradlePoint took 14 years from launch to exit; and 10 years from their first institutional investment round. Both of these time data points are slightly longer than other exits in the industrial tech vertical. The company has great metrics in terms of cash efficiency and providing sizable returns for the early and growth stage investors.
I have now updated the “Industrial Tech Exits” Google Doc with this deal. Found here
In June 2007 John Doerr took stage for a Ted talk and got emotional talking about climate change. The battle was on and cleantech 1.0 momentum was in early innings.
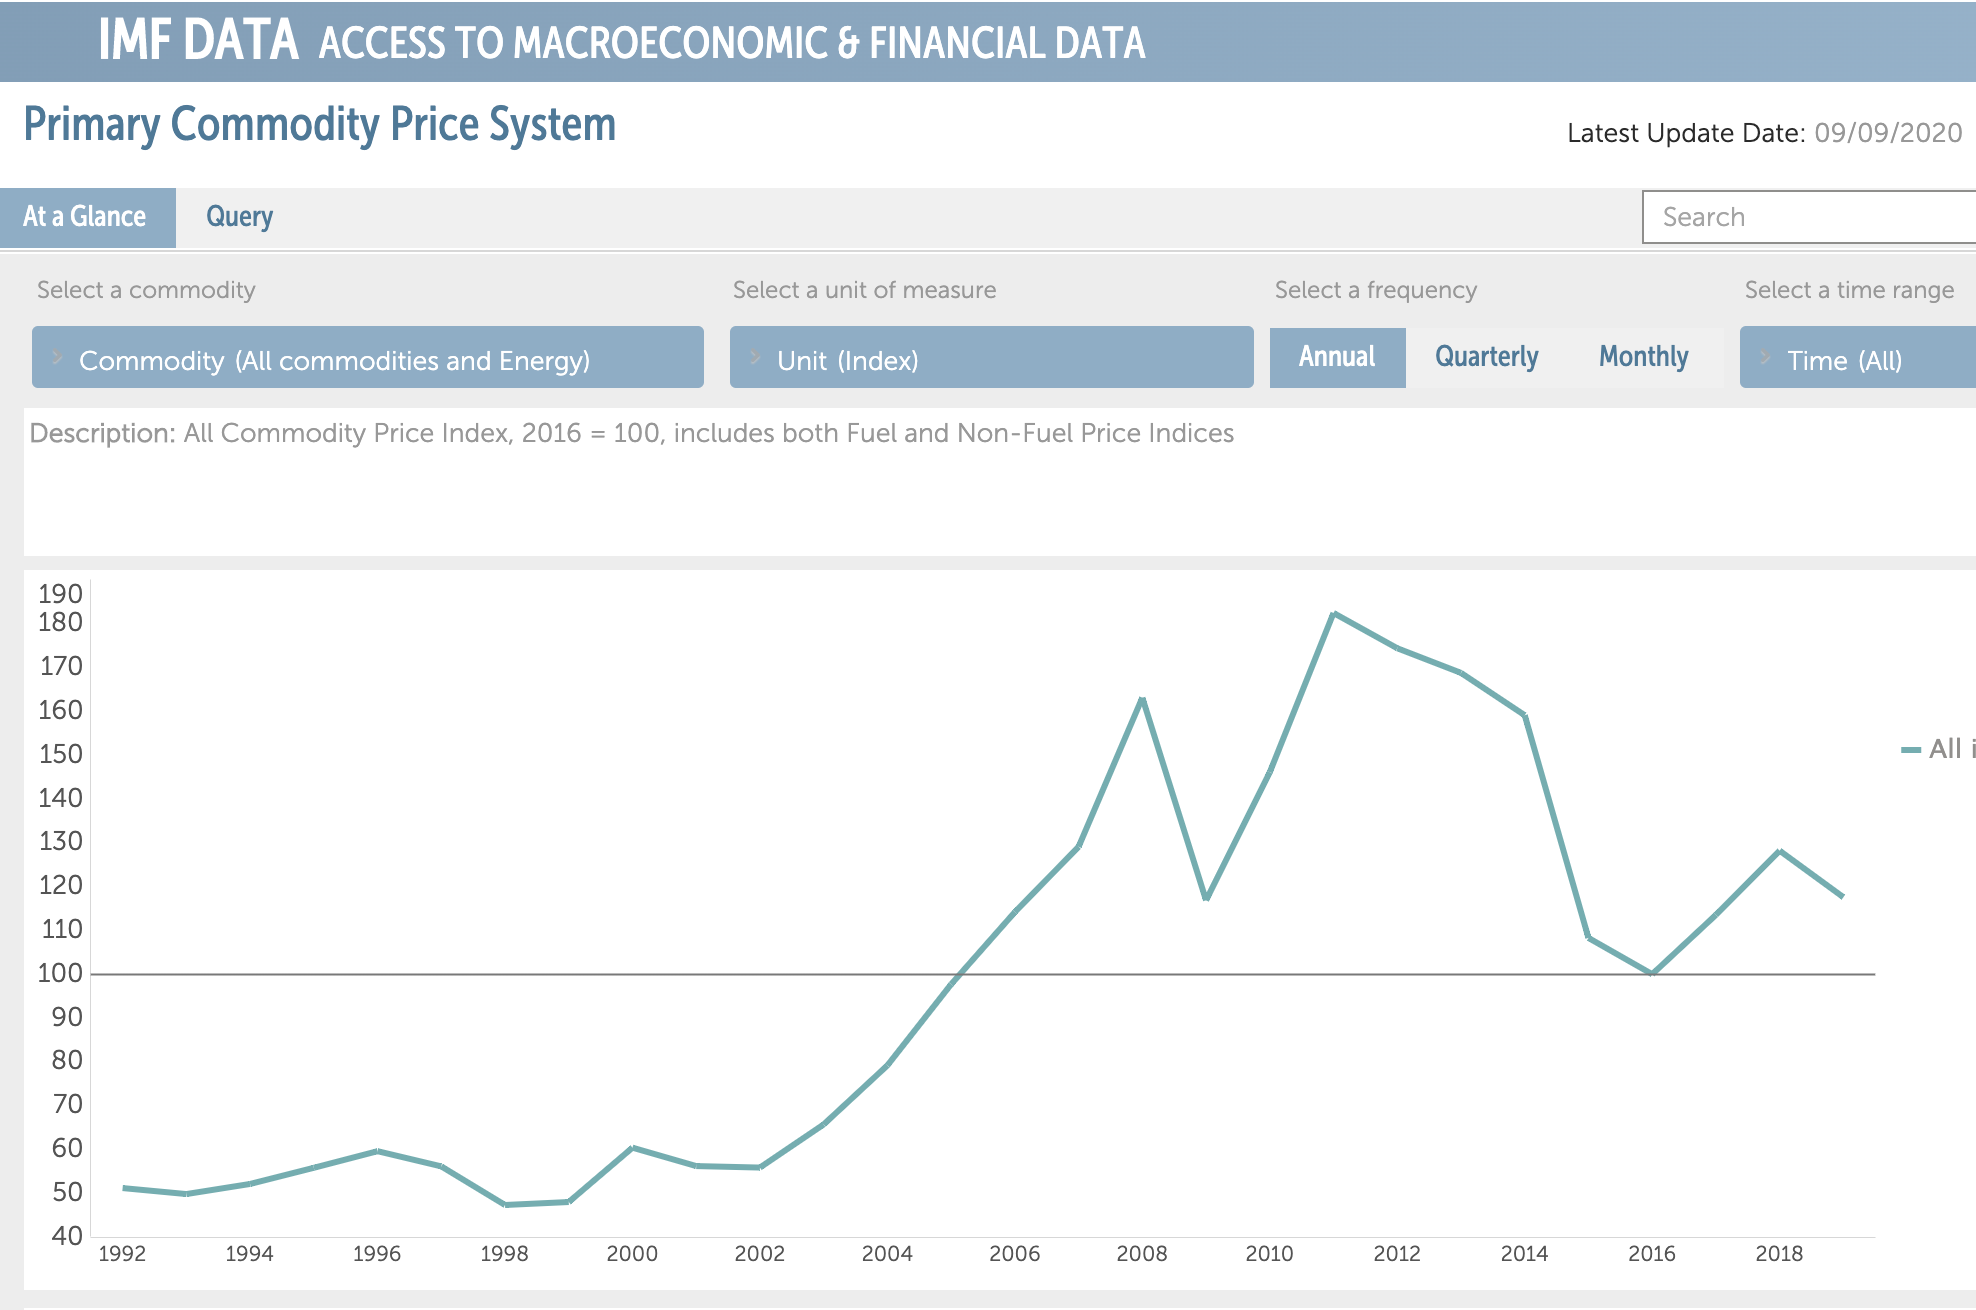
I now look back to speeches like this one, press highlights, old investment memorandums, etc. and almost EVERY message was based on price. So many investments were a hop/skip/jump away to being able to compete on price with traditional energy sources. The reason for this messaging was because commodity prices were going UP and meeting renewable alternatives at the higher cost tiers. Here is an Index chart from the IMF on global commodity prices over the past few decades.
As you can see here, cleantech 1.0 was a false front because new energy investors and operators were gaining confidence in a battle that was taking place outside of normal bounds. Therefore, when energy prices fell in the early 2010s, the near-term goalposts for many capital intensive renewable companies moved further into the distance…. bankrupting most. But these cleantech 1.0 investments did ultimately help.
Since the peak of late 2000s and early 2010s, commodity prices have plummeted and (driven by those early investments) renewable prices have chased them down even faster.
This framework us one I use to evaluate an industry’s readiness for change:
Is a new technology viable due to temporarily high incumbent costsor is the new technology sufficiently developed to chase the incumbent solution WAY down the cost curve? (to use a sports analogy: are we competing on a level playing field, or is our opponent handicapped? Don’t celebrate too much if the conditions are non-standard to your benefit!)
What makes now an exciting time for renewables is that nobody is really talking about price competition with traditional fuels anymore. We are way down the price curve: fuel prices are low and renewables are OK competing at those levels. And if there is a discussion around price, it is usually between different types of renewables.
This will be a 4-part mini-series on utility scale O&M. There are 4 different types of O&M where standardization is occurring:
Utility Scale Solar: priced per MW
Utility Scale Wind: priced per turbine
Utility Scale Distribution: priced per pole, or per mile inspected
Still developing segments: battery O&M; utility-owned rooftop O&M
I am starting in O&M as these prices are the most standardized. After this 4-part series I will get into utility scale construction contracts for these assets. And will end with development costs, as the development stage still has very little consistency and is where the largest value arbitrage still exists for software providers.
Part 1: Utility Scale O&M – 🌞 SOLAR ☀️
The average utility scale solar site is massive. 1 MW solar capacity site takes up about 2-4 acres. A few years ago a 100MW solar site would have been award-winning. But now renewable energy developers are routinely developing mammoth solar sites between 400MW to 1 GW+ in size.
As a result of the the increase in scale, a utility scale solar farm will sprawl between 300 to 3,000 acres. The size of the projects require new technology solutions.
How did O&M inspections use to happen?
Techs would walk a site every year. They would inspect each panel with a thermal imaging ray gun and look under each panel to make sure a wire routing to the inverter wasn’t busted or eaten by a pesky animal. For a 100MW site, two techs would cover the asset twice annually. Not only is this incredibly inefficient, but the remote conditions actually make for unsafe work environments.
The above photo is captured from a drone that has a thermal camera attached. The thermal camera immediately informs a pilot and operator which panels are not operating correctly.
The FUTURE
A drone’s ability to cover massive amounts of land in relatively short time periods, all while allowing a pilot to be more secure has made the product a perfect fit for the renewable energy industry.
For sake of simplicity, I am going to use a 100MW solar site as an example. (About 300 acres in size) Most operators of renewable scale solar are looking for monthly inspections. And the price range for a fully-baked service is around $300 per MW per year. This breaks down into:
$300 per MW * $100MW site = $30,000 drone pilot & drone-related aerial analytics
While most large-scale operators are now building their own drone fleets, the cost above assumes an outsourced drone pilot. A drone pilot for that scale is about $500 per flight: so 12 flights is $6,000 for the year in drone pilot costs. Removing this $6,000 from the $30,000 per site opportunity yields approximately $24k in revenue available to the aerial analytics platform powering the solar inspection, or about $240 per MW/year.
In 2020, analysts expect over 12 GW of utility scale solar to be installed in the US. This growth equates to $3.6M in new aerial analytics software contracts becoming available as these new utility scale solar farms energize in 2020.
Given how comparable the unit of pricing is here, there has been incredible competitive pricing pressure in this figure over the past 2-3 years. Aerial analytics firms focused on O&M in renewables used to get $600+ per MW flown. For this reason, I suspect we will continue to see this O&M price drop down closer to $50-100 per MW annual pricing on the O&M side.
The upside, of course, is that even at this reduced pricing a 1 GW site still creates a $50-100k/year software opportunity.
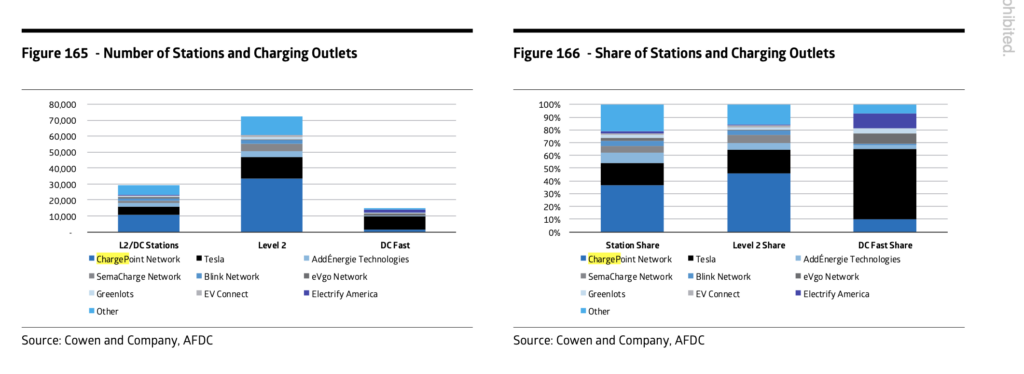
Why is ChargePoint a good SPAC target? Right now there are about 90,000 public chargers in North America and ChargePoint represents about 30-40% of that network. If you believe that mobility is moving from hydrocarbon fuels to electrons, then ChargePoint is a key lever in that transition. And should be a household name in the future.
Neither party has yet to release public financials, so I will not comment there. However, the SBE SPAC is a $300M vehicle and the average SPAC attains 10-20% of the target company through the capital investment. Using this framework, it appears that ChargePoint will aim to enter the market somewhere between a $1.5BN to $3BN valuation. The company has raised $700M to date and was valued around $1.2 billion in a financing round announced in Q1. So some of these valuation levels will provide for a nice return to early shareholders.
Some of the earliest investors on the cap table have been involved for over a decade. While the IRR may not be great, these investors saw the opportunity to be the largest EV charging network in the US. And that early conviction should be rewarded as ChargePoint has persevered through the years. I hope they succeed in the public markets.