Category: The Energy & Industrial Transition

Labor Day: Thanks to the utility workforce

Labor Day: Thanks to the utility workforce

There are 540,000 employees tagged to the US utility industry. According to NAICS this definition includes:

  • Electric Power Generation, Transmission and Distribution: NAICS 2211
  • Natural Gas Distribution: NAICS 2212
  • Water, Sewage and Other Systems: NAICS 2213

The composition of this workforce is actually down by ~3% over the past decade. While I am uncertain on the future employment growth in the industry, I am certain that the underlying types of jobs (wind technicians, battery engineers) are going to change.

The majority of the current workers are front-line, either for installation, repair or meter reading. At times these workers have thankless jobs and are asked to work at all hours in response to storms and other difficult situations. There are many reasons to be thankful on Labor Day, but here is another to add to your list: if you see a utility worker, be sure to say thanks.

Sunday Sales Series – Retail Energy Contracts

Sunday Sales Series – Retail Energy Contracts

Today’s sales topics are going to cover the commissions that retailer energy providers, rooftop solar installers, and community solar firms are willing to pay to acquire residential and commercial customers:

I co-wrote this post with Jonathan Crowder. And before getting to the numbers, w need to define a few key terms:

Originators: In the energy space the main forms of customer acquisition remain offline brokers. These brokers operate through door-to-door sales, outbound phone sales, and other traditional sales techniques. Online origination through state sites, comparison sites, energy websites and connected home /clean energy brands are the fastest growing form of customer acquisition

Upfront: the amount that an energy firm is willing to pay upon confirmation of a customer’s enrollment. The energy firm usually pays this spiff upon receiving the customer’s payment information – or upon the the payment of the first month’s energy bill.

Residual: the % of the supply portion of the energy bill that an energy firm is willing to pay the originator for as long as the customer stays with the energy firm. This payment option is more specific to retail energy and is meant to incentivize the originator to not keep flipping the customer to another provider every time the customer contract comes up for renewal. These payments are done monthly, in arrears, and are usually tied to the size of the customer’s energy bill.

A “mil”: In the energy compensation narrative, a mil refers to Is 1/1,000th of a US dollar, or 1/10th of a cent. This is important to know because the “mils” are how energy providers create business alignment with originators. The mil is used to calculate how much an originator earns in monthly commissions. For example, if a small business uses 10,0000 kWh of energy per month, and the originator agreed to a “5 mils” contract, then the originator gets paid a monthly amount of (10,000 kWh * $0.005 dollars per kWh)= $50 per month of commission.

Contract Term: Like a cable bill or your phone plan, many energy contracts can range from prepaid monthly plans to 3, 6, 12 or 24+ month contracts. Some community solar contracts are 5 years, or more! And a rooftop solar contract is ultimately tied to the house (vs the homeowner) and can be 20+ years long. Like with other home services products, terminating a contract early likely results in a pre-payment penalty.

Renewal: At the end of a contract, customer’s can either roll over into a new plan with their existing energy supplier or search for a new firm.

Rate: The amount, usually charged per kWh (just like your utility bill), that you pay for energy. It is important to note that there are different prices, depending on the portion of the energy bill you are covering. Some firms (retail energy providers, community solar) may just be substituting out the supply portion of your energy bill. Other offerings, like rooftop solar, may include both supply and broader distribution charges as part of their rate.

SALES CONTRACTS

Since we are talking about a commodity here any additional margin paid to a broker is very simply added to the underlying rate. If a retailer is pricing energy at 10 cents and you want to make a penny of margin as an originator, they will simply allow you to Mark the rate as 11 cents in your reseller agreement. The problem with this structure is that the least informed customers can pay very non-standard rates if they are sold hard by a broker. I have heard horror stories where offline brokers charges a 50% premium to the underlying commodity.

Thankfully, digitall experiences are bringing better experiences. And there is greater consistency to what online brokers are able to charge, and therefore able to pass along to the consumer. Here they are:

Residential consumer, Texas: $125 upfront 2-3 mils. The average texas home consumes around 15,000 kWh so the retailer is willing to pay up to $175 for the first year of contract and about $50-75 per year thereafter.

Residential consumer, non-Texas: $75 upfront and 2-3 mils. The average US home outside of Texas consumes about 10,000 kWh so these accounts are smaller and usually less profitable. This results in about a $100 first year payment and $30-40 annual value thereafter.

One of the most ludicrous part of this energy experience is the equivalent “rake”. At best, a customer can expect to save around $50-75 a year by choosing a retail supplier that isn’t their own utility. And the retailers pay nearly double that to acquire a customer. The cost to educate and acquire a customer is at least 2x the savings – so the system is mostly broken.

Commercial consumer: standards are variable but usually ranges from 3 to 10 mils depending on the size of the account. At Choose we had a lot of small accounts (restaurants) who were around 30,000 kWh per year so they would pay us about $150 per year at 5 mils. Once we had a huge warehouse in the Port of NJ sign up through our site at 10 million kWh+ annually and we made tens of thousands of dollars each year on one meter. This range shows how variable the commercial market can be in the supply arena. It is these big accounts where offline brokers focus and try to add large broker fees to make mega-commissions and a lot of the “fat” still lives in the system.

Bill Gurley famously covered the different “rakes” of online platforms. Online sites commissions range from ~3-30%. In retail energy, if the average rate is 10 cents supply, then the originators are taking about a 5% take- pretty low. However, if you take into account that this is a commodity with lower margins, at these commissions the originators capture as much as 50% of the profit. And that is the real apples-apples comparison here.

Next week we will cover “green retail plans”, community solar and rooftop solar origination figures. I will also cover how retail suppliers coordinate to monetize on the broader connected home opportunity.

Fire 🔥 and Technology’s Response

Fire 🔥 and Technology’s Response

Unless you have been under a rock for a few months, you know that yet another California fire season started months early. The volume and ferocity of these fires seems to grow every year. And recent data that less than 20,000 forest firefighters are working in the state shows that we do not have enough manpower to address these infernos head-on. Rather, we need to use next-gen technology solutions to amplify our efforts in prevention, detection, and immediate response to these fires.

There are a number of companies trying to help solve this problem either through observation, prediction, and response and I wanted to highlight them here today:

Overstory: (Link) Combines AI and satellite data to support vegetation management at utilities. Vegetation encroaching upon poles & wires is a leading ignition cause.

Descartes Labs: (Link) Applies ML to data sources like satellite imagery for better forecasting, monitoring and historical analysis, enabling clients to collect data daily from public and commercial imagery providers and calibrate it for scientific analysis. This satellite imagery can help spot fires at their infancy.

Jupiter Intelligence: (Link) Uses AI and proprietary climate modeling techniques to deliver asset level predictions on peril impact: fire, wind, heat and water perils, from 1 hour ahead to 50 years. (Note: Energize is an investor here!) The company also received a Moore grant to build fire predictions for California public entities.

Zonehaven: (Link) Combines critical data and modeling capabilities to help first responders and communities understand, minimize and respond to an emergency. As fires become more commonplace around our towns and cities, we will need to have better response and evac plans.

Of course, a top long-term priority for addressing climate change is to continue to invest in new tech that is decarbonizing our power and mobility sectors. In the meantime, though, we must invest in adaptation technologies to live alongside changes in our environment.

Who else is leveraging new technology to address the fire problem?

** ADDING NAMES SHARED FROM TWITTER NETWORK **

Terrafuse.ai (Link) Actionable climate intelligence for a resilient earth

FirePerimiter.com (Link) Situational intelligence for public safety based on collaborative, real-time disaster visualization

GeoSite Inc: (Link) Geosite is a cloud-based geospatial data marketplace with integrated spatial data management and collaboration.

BuzzSolutions: (Link) Safeguarding the world’s energy infrastructure through: “Artificial Intelligence, Actionable Insights and Predictive Analytics for Power Line and Grid Inspections”

NearSpace Labs: (Link) Near Space Labs provides timely wide-scale imagery from the stratosphere at down-to-earth prices.

All Energy Transition Projections are Wrong

All Energy Transition Projections are Wrong

Energy analysts are bad at predicting system-wide changes. Every year the Department of Energy and other agencies vastly underestimate the new energy resources being energized across the country.

The same incorrect predictions are now also occurring around electric vehicles. The graphs below on EV adoption projections shows how key industry research groups are now also incorrectly predicting EV adoption. Each of these groups have to keep re-upping estimates every subsequent year.

The main entities that predict these levels include: OPEC, EIA, and BNEF. Of course, some of the oil & gas projections should be taken with a grain of salt as they are scared about this transition! Knowing that, as seen below, there is a big difference between the estimates of these groups!

Big, growing markets with a range of projected outcomes allow for contrarian operators and investors to create large businesses with great returns. Energize is energized about this opportunity.

Energy Transition M&A: Is a new wave coming?

Energy Transition M&A: Is a new wave coming?

(Note: this post was co-authored with Kevin Stevens, Partner at Intelis Capital)

Much like its industrial counterpart, energy technology is broad, but in a different way. Energy has the usual two categories, enterprise, and consumer, but also contains “hard” technologies like solar and battery storage. This bifurcation along two segments creates varying outcomes.

Since the energy transition is an emerging trend, data points for exits are limited. The companies that have exited are the success stories of “cleantech 1.0”. The average Series A date in our dataset is Q2 2008 which is the heart of this era and the majority of exits occurred before the end of 2017. 

Capital for energy technology largely dried up between 2009-2016, so it’s unsurprising that exits became less common as fewer companies were funded. Additionally, it’s likely the outcomes in our dataset are smaller than future outcomes as we haven’t seen many exits in today’s market which values technology even more favorably than just a few years ago. Link to analysis can be found here.

CONSUMER TECHNOLOGIES

Using the median data here’s the narrative for consumer technologies in energy (note: Tesla and Sunrun are outliers):

  1. A startup raises $9.6M on a ~$24M post-money valuation
  2. Over the next 6 years, the company raises an additional $165M in capital prior to exit
  3. At the time of exit, the startup has an approximate revenue/bookings of $108M for a cash efficiency of 65%.
  4. The company exits at $972M, meaning the average multiple is 6.4x Trailing Twelve Month revenue. And the exit price is a 2.9x multiple on total invested capital, a 57.9x return on the Series A, and a 1.2x return on the pre-exit round.

ENTERPRISE TECHNOLOGIES

Using the median data here is the narrative for enterprise technologies selling to energy companies:

  1. A startup raises $5.4 on a ~$16M post-money valuation
  2. Over the next 5-6 years, the company raises an additional $40M in capital prior to exit
  3. At the time of exit, the startup has an approximate revenue/bookings of $157M 
  4. The company exits at $557M, meaning the average multiple is 4.1x Trailing Twelve Month revenue. And the exit price is a 10.5x multiple on total invested capital, a 21.6x return on the Series A, and a 1.5x return on the pre-exit round.

What are the comparative takeaways for each of these segments?

  1. The data points are limited, we only have 5 true exits in the consumer data set with two big outliers – Tesla and Sunrun – and only 8 documented exits in the enterprise segment. As with the industrial analysis, the larger narrative is how fell exits there are- and that the graveyard doesn’t necessarily speak the truth.
  2. In these companies, early-stage investors did extremely well. This makes sense since most of the Series A investors in this dataset financed product development in a category that was unproven. 
  3. Consumer businesses require more capital to grow but also reach larger markets. As a result, they earn higher multiples and exit prices than their enterprise counterparts. 
  4. At 16x trailing twelve-month revenue, software companies earn the highest multiple. hardware companies earn just over 5x. And a surprising narrative is that the “tweener” companies that merge hardware and software actually have the lowest multiple at 3x.
  5. There has been a lull in exits which makes intuitive sense. From 2007-2012, clean energy-related startups received $20B annually in new funding – that number plummeted to $3B from 2013-2017. Fewer companies funded = fewer companies to exit. 

Given the average time to exit post a Series A is 5-6 years this means that the renewed funding levels in 2018 and 2019 will likely start to produce headline exits in 2023. Grab your popcorn!

Matt Ridley’s Newest Book Covers… ENERGY Innovation!

Matt Ridley’s Newest Book Covers… ENERGY Innovation!

Matt Ridley is the author of a number of award-winning books. Notable hits include The Evolution of Everything and How Ideas Emerge. My personal favorite of his is The Rational Optimist. One of the many reasons I enjoy Matt’s writing is his ability to deconstruct complex outcomes to their foundational drivers.

I am working on a longer-form paper that details some of the emergent behaviors of technology in the energy and industrial transition. In the research process I have engaged a number of complexity and platform leaders. One of those leaders, the esteemed VC Bill Gurley of Benchmark, pointed me to Matt Ridley’s latest book, How Innovation Works and referenced that there is actually a section on energy innovation. Well, one week later and I have covered the book and am happy to give it a ringing endorsement. Whether you are new to energy or an experienced pro, you will learn something new. And, classic to Matt Ridley, he frames energy innovation in a refreshing way.

My Favorite Themes, Quotes & Takeaway from the Energy Section

Theme 1: Failure is the father of Innovation

Innovation is itself a product, the manufacturing of which is a team effort requiring trial and error.

Edison called his work “the invention business”. “He remained relentlessly focused on finding out what the world needed and then inventing ways of meeting the needs…his method of invention was always trial and error. In developing the nickel-iron battery his employees undertook 50,000 experiments. (!!)

“Inventing is 1% inspiration and 99% perspiration”

Theme 2: Innovation is Inevitable

I am fascinated by how technology inventions seem to converge at a specific point in time. And particularly how this convergence occurs after extreme technology advancement and trial/error reminds me a lot of Michael Waldrip’s Complexity. The technologies that enable a transformation are all advancing independently AND interacting with each other. Add in a number of entrepreneurs, acting as catalysts, and suddenly new structures emerge at the “edge of chaos” that result in a new, higher order of efficiency. This arrival to a ‘higher order’ occurred with the lightbulb, and looks a lot like what is happening today with the interacting forces driving a digitized and decentralized energy network.

“Simultaneous invention marks the progress of technology as if there is something ripe about the moment. It does not necessarily imply plagiarism. In this (steam engine) case, the combination of better metalworking, more interest in mining and a scientific fascination with vacuums has come together.. to make a steam engine almost inevitable.”

“The lightbulb emerged inexorably from the combined technologies of the day. It was bound to appear when it did, given the progress of other technologies.”

Theme 3: Innovation Turns Ideas into Practical, Reliable and Affordable Reality

There is a difference between invention and innovation. According to the book, innovation is how famous names like Thomas Edison rise to the top of the 21 inventors who lay claim to inventing the lightbulb. Edison was focused on innovating and specifically on reliability as he tested over 6,000 different filaments for duration and cost.

The ability to take a technology invention and gradually (through testing) get to a customer-available product is where innovators stand out.

Theme 4: Innovation in Energy is Evolution, not a Series of Revolutions

“Long after the key technologies had been invented, innovation continues.”

The first turbine was 2% efficient and today a combined cycle gas turbine is 60% efficient. This 100+ year journey was a collaborative effort with no 1-time transformations. Innovation came from small steps of experts, testing along the way.

The book then also explains why certain atomized production processes improve. And then goes into great detail on how other large scale projects, hampered by the rising costs for regulation, begin to dis-innovate. This is my favorite line:

“Nuclear is ill-suited to the most critical innovation practices: learning by doing. ” The best products leverage subject matter experts to tweak and innovate along the way. The experts find a way to test, iterate and improve. This testing happened successfully with shale gas exploration and fracking: west Texas wildcatters who had small companies were able to buy mineral rights from land owners and were more nimble to do small tests. In other, more regulated oil & gas countries, this innovation could not persist as the state/country owned the land rights.

What this Means TODAY

The installed bases of new energy technologies is gaining critical mass: wind, solar, batteries, EV charger. Wind and solar have gained efficiencies over the years: wind OEMs have made increasingly aerodynamic and larger blades alongside improved gearboxes and materials costs; solar is improving absorption rates and further accelerating efficiency through better inverters, trackers and 2-sided panels. In addition to the hardware, operators are getting better at O&M as they leverage remote communications network, drones, and predictive analytics. All of these continued innovations are consistent with the slow & steady march towards record-setting productions levels.

This installed renewable base coupled with advances in data products, connected devices, and software management, are apt to create a new wave of simultaneous digital advancements. These software solutions will not only accelerate the efficiency of these verticals but improve interoperability with the operating environment. As a result, we are likely to see innovative customer behaviors as these energy consumers adapt to the new product suite available. While fantastical now, these prospective new products and behaviors will seem like inevitable advances in the near-future. How fortunate are we to have the march of innovation?

Summary

In How Innovation Works, Matt covers other verticals Public Health, Transport, Food and Communications. Then he pivots to more horizontal themes such as the economics of innovation, and identifying fads and frauds. He ultimately wraps up with how to get around (the expected) resistance to innovation and which cases are worth fighting. Again, go buy the book – the perspective is clarifying and refreshing.

Hiro Mizuno & Investor Responsibility During the Energy Transition

Hiro Mizuno & Investor Responsibility During the Energy Transition

Last month, Hiro Mizuno was on the Capital Allocator’s podcast with Ted Seides. Ted runs and is the host of the Capital Allocators podcast, and I am a regular listener. I encourage you to add his podcast to your library.

Hiro Mizuno is the recently departed Executive Managing Director and Chief Investment Officer of GPIF, Japan’s $1.5 trillion Government Pension Investment Fund. During the conversation with Ted, Hiro spent time covering how to align ESG metrics to investment performance. Near the end of the conversation Hiro goes on a great monologue about investor responsibility and how active investors can take on the responsibility of addressing ESG metrics through governance influence- and he specifically covers carbon-generating industries..

“I refuse to actually compete for less carbon footprint of the global portfolio. We could do that by divesting a carbon-heavy industry. But given our universal ownership approach, it doesn’t make any difference. Maybe we divest coal, tobacco…. But from our universal ownership perspective, it sounds like we are passing ownership of those problematic businesses to the people that don’t care about it. We don’t want to divest the carbon footprint of our portfolio by divesting the carbon-heavy industry as that doesn’t reduce the carbon footprint of the world.”

I really appreciate how Hiro talks about the responsibility to address problematic businesses. He wants to own the problem so that he can improve the outcome. What a powerful statement.

At Energize, most of our digital investments address the renewable and/or digital side of the energy and industrial transition. However, as shown yesterday in our petrochemical review, our goal is to be a student of the entire energy ecosystem and understand how digital technologies can provide value across different energy types. The fact is that transition fuels like natural gas and their byproducts will be around for a long time and digital technologies that advance renewables (like drones, or cybersecurity) can also be leveraged into providing a more secure and environmentally friendly transition for these carbon-based fuels.

We embrace this responsibility, are tracking our ESG metrics, and seek to advance the entire transition. Here is to a responsible, digital, energy transition. And thank you, Ted & Hiro, for a great discussion.

The Energy Transition has a Distribution Problem

The Energy Transition has a Distribution Problem

In the power landscape, one particular graph has been a key area of focus: the Lazard Levelized Cost of Energy chart. An Energize-equivalent summary of the chart is below:

As the chart highlights, renewable energy is now more cost effective than the ongoing operating costs of conventional generation. Wind and solar are the cheapest form of new energy generation. And batteries will be paired with these intermittent generation sources to further decelerate carbon-based generation.

Despite rooftop solar’s breakneck growth, big swaths of the US will continue to be served by a utility-scale generation source. And renewable energy’s greatest inputs (wind, solar) are generally most abundant outside of key metropolis areas – see the graph below and the wind speeds in the middle of the country!

Many power developers are placing big investments in utility scale transmission lines to move renewable power from the midwest to the eastern seaboard. Just like a startup needs an easy way to get its’ product into customer’s hands, our energy industry needs better mechanisms to deliver our renewable energy to the end-consumer. And unfortunately, digital investments in transmission are mostly nonexistent.

Great platforms, like Arcadia and Level10, are attaining incredible growth by delivering a renewable experience to renewable-inclined consumers and corporations. And firms like Amperon are making congestion and demand data more readily available. Ultimately, we are going to need structural changes to our transmission system. And we suspect that digital solutions will play a big role in that change, just as these digital solutions positively impacted the cost curves for solar & wind costs. If you are working on a digital technology that advances the transmission system, reach out.

Evaluating the Successful Industrial Technology Exits

Evaluating the Successful Industrial Technology Exits

The definition of industrial technology is very broad. And the best industrial technologies ultimately get used across a number of manufacturing, energy, real estate, healthcare, logistics and OT industries.

Due to the nebulous nature of this space, the M&A narrative is not well-covered. Last week I asked IndustrialTech twitter to highlight successful exits in our space. Special kudos to Ty Findley for sharing more history on the space. Here is a list, with some data points and takeaways:

You can click on the picture to get a bigger version. And here is access to the Google Doc that contains this file. If you have more information, you want to add, please do. Link to the Google Doc Here: Industrial Tech M&A

Using the median figure, here is the narrative;

1- An industrial technology company raises a $11.8M Series A at a $41M post-money valuation.

2- Over the course of the next 4 years the start-up raises another 2 rounds and raises nearly $50M in new capital for $66M in total capital received prior to an exit.

3- By the time of exit, 4 years after the Series A, the start-up achieves $30M in revenue/bookings for a cash efficiency of 45%.

4- The company exits at $775M, meaning the average multiple is 16.5x Trailing Twelve Month revenue. And the exit price isa 9.7x multiple on total invested capital, an 9.1x return on the Series A, and a 2.5x return on the pre-exit round.

What are some takeaways

The graveyard doesn’t speak and these are the best of the best exits for the space. So recognize that the average deal is far less performant than this outcome!

When upside exits rarely exceed $500M, entry valuations and knowing the true TAM and market dynamics is key. The most rewarding exits from this list are the ones where capital efficiency remains a focus for the management team and little excess capital is invested to try to force the acceleration of a deliberately slow purchasing cycle.

Ty Findley, Santosh Sankar, Chris Stallman, and Julian Counihan all recently contributed to an excellent post on “Why VCs Must Specialize” and I agree with the theme: smarter knowledge of your vertical dynamics drives better evaluation and price awareness so that when a start-up is going adrift, alarm bells are raised to realign for upside success. And to keep valuations within a reasonable range to allow for upside returns.

Finally, the high revenue multiples and potentially abbreviated time to exit for the most successful companies (other than OSIsoft!) shows how acquirors pay premiums for access to the industrial customer, but need to see non-trivial revenue levels (almost $30M+) before paying up.

I hope we can add many more to this list in the coming years.!

Calling it: OSIsoft is the Industrial Tech Deal of the Year

Calling it: OSIsoft is the Industrial Tech Deal of the Year

I am calling it: OSIsoft’s acquisition by Schneider Electric controlled AVEVA Software is the industrial technology deal of the year.

While I am sure that there is industrial technology M&A happening as you read this… and there are some great names like ChargePoint and Desktop Metal are in the rumor mill for a SPAC, it will be hard to top the returns profile that OSIsoft generated for their select investor group.

The structure here will cover a brief summary of the company & product, financing history, and why AVEVA is an especially interesting partner.

HISTORY

OSIsoft was founded in 1980 by Dr. J Patrick Kennedy, a legend in the industrial technology space. 40 years ago. Older than the author and many readers of this post. The company’s core product is PI Systems, a data historian. The PI historian is a data capture, relay and management platform purpose-built for the physical operating environment. If you are looking for a product with incredible retention, it is hard to find a “stickier” one in any market. This is why:

Data analysis primarily occurs on high value assets with extended life-spans: 10-40 years. And once a historian platform is selected it usually lasts the life of that asset. AND when the next asset is installed, of course the operations team at the industrial entity is going to select the same historian so that there can be back-end consistency of data management to allow for simpler data analytics. this system perpetuates such that OSI claims to have 95% of their original customers and be extracting data from over 19,000 industrial sites. This embedded product stickiness is why the company has been able to command high prices for their product and generate material profit.

FINANCING HISTORY & EXIT PROFILE

Grade: A+ for founder, A for investors, B for SoftBank

Dr. Kennedy’s cash management at OSIsoft is the talk of legends. He ran the company on its’ own cash flow from the earliest of days.

Investment #1: Summer, 2011

It wasn’t until summer 2011, over 30 years after starting the business, that Dr. Kennedy decided to bring on external capital. At the time, his business was already generating around $200M of revenue and a sizable EBITDA profile. During the raise, he sold 30% of his company to TCV and KPCB’s Green Growth Fund in equal segments.

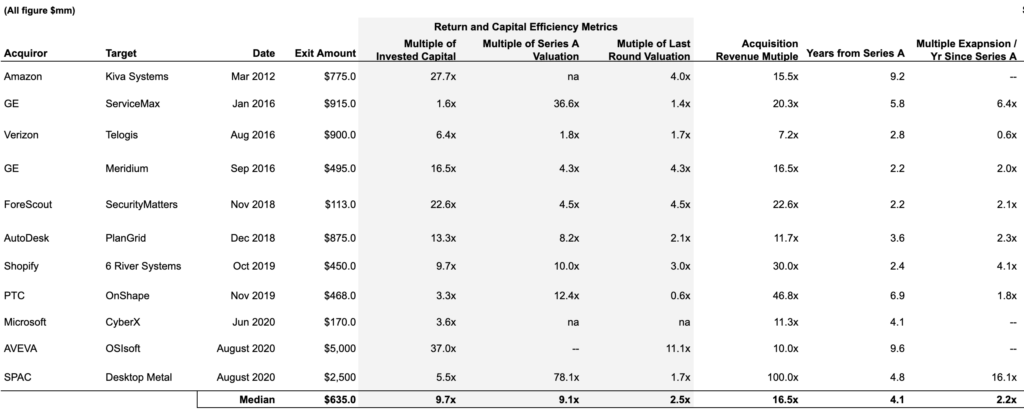
He executed a capital raise at a $450M valuation (likely for secondary purposes) by selling 30% of his company for $135M. The company was just about to cross the $200M revenue benchmark and was likely already very profitable. As shown below, this ~2x revenue multiple was a great entry point for the investors.

Investment Event #2 PE Growth Event to SoftBank

In May 2017, SoftBank’s Vision Fund came knocking. With the business now generating around $350 in revenue, SoftBank paid a whopping $2.9BN entry valuation, or ~8x revenue . During this event, the earlier TCV and KPCB investors exited at a very handsome return profiles: assuming minor dilution, back of the envelope calculates show the growth equity round executed by the earlier investors produced greater than a 6x return in the 6 years of holding the business.

Today’s Exit: AVEVA acquiring OSIsoft

Metrics released today show that the business is now at $500M in Trailing Twelve Month Revenue. This means that the company is still growing about 10-15% in topline revenue per year, an impressive figure in the industrial technology space for such a sizable profile. That results in a ~10x revenue multiple.

And as suspected, the company has a very healthy 30%+ EBITDA margin.

This exit produces a mammoth return for Dr. Kennedy, who still owned a majority of the company. SoftBank gets to generate an approx. 1.7x return, which is not too shabby for 3 years given the absolute dollars that the Fund was able to invest into OSIsoft.

The FIT with AVEVA

Grade: A-

Aveva is a global leader in industrial software. The company is undergoing a transition from a mostly perpetual sales model to a recurring sales model. While this transition is never easy, Craig Hayman is considered a world-class operator in the space. AVEVA has an embedded $700M software business and the combination of AVEVA and OSIsoft is very powerful as AVEVA already has a few data historians within their technology suite.

In fact, AVEVA now has three historians, each in complementary verticals! This means that AVEVA is now the de-facto historian across of nearly every asset industry. The only true competitors outstanding now would be Bazefield and GE.

AVEVA’s three different historians:

#1 OSIsoft: primarily serving the process industries: oil & gas, chemicals, pharmaceuticals, etc.

#2 (assigned from Schneider Electric) Wonderware: broad application with an emphasis on post-capture analytics

#3 (acquired through M&A), InStep’s eDNA product. eDNA is also an enterprise-based historian primarily used within the utility and power market.

While I suspect AVEVA’s marketing team will likely want to simplify branding, the fact is that each of these entities has strong brand presence within their specialty verticals. And this product stickiness and brand strength should allow AVEVA and OSI to maintain market share and pricing defensibility going forward.

CONCLUSION & TAKEAWAYS

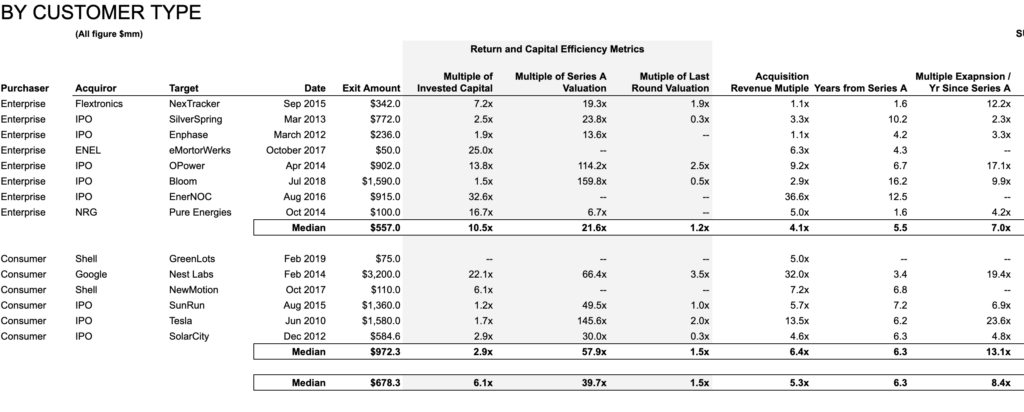
Top marks for investor returns and capital efficiency. Dr. Kennedy walks away with over $2.5BN in proceeds and was very capital efficient along the way. He has the highest capital efficiency marks of any company in our industrial technology data set. (releasing that in a few days)

AVEVA and Schneider Electric win control of a crown jewel in the asset-heavy market. If you believe that data and data management is a requirement for the next generation of industry, then OSIsoft is an invaluable asset and the price is fair and consistent with other elite assets currently in the software market.

The most important subtly to the story is how this is a 40 year success story. In the energy and industrial markets, there are no overnight successes. These customers buy slowly because software gets applied to real, operating assets. Mistakes cannot be made. Aligning a capital table with this reality is key. And if you allow results to compound for 40 years, good things tend to happen!